Figure 9.

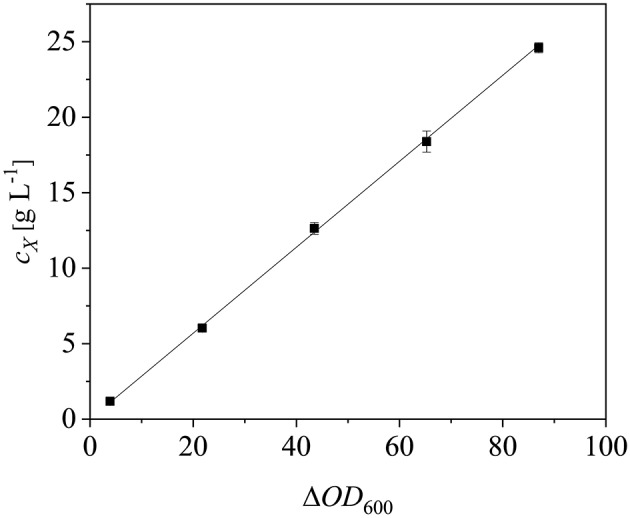
Correlation between cell dry weight (cX) and optical density (ΔOD600). Error bars show standard deviations of triplicates. The data were fitted linearly (R2 = 0.9994).

Correlation between cell dry weight (cX) and optical density (ΔOD600). Error bars show standard deviations of triplicates. The data were fitted linearly (R2 = 0.9994).