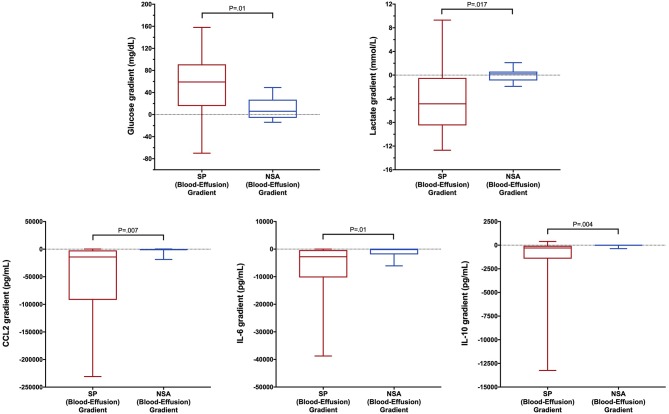
Figure 3.
Box and whisker plot of blood-effusion gradients of glucose, lactate, CCL2, IL-6, and IL-10 concentrations in dogs with SP and NSA. The central line within the box indicates the median, the box represents the interquartile range and the whiskers represent the minimum and maximum values. P <0.05 was after correction for multiple comparisons was considered significant. CCL2, C-C Motif Chemokine Ligand-2; IL, interleukin.

