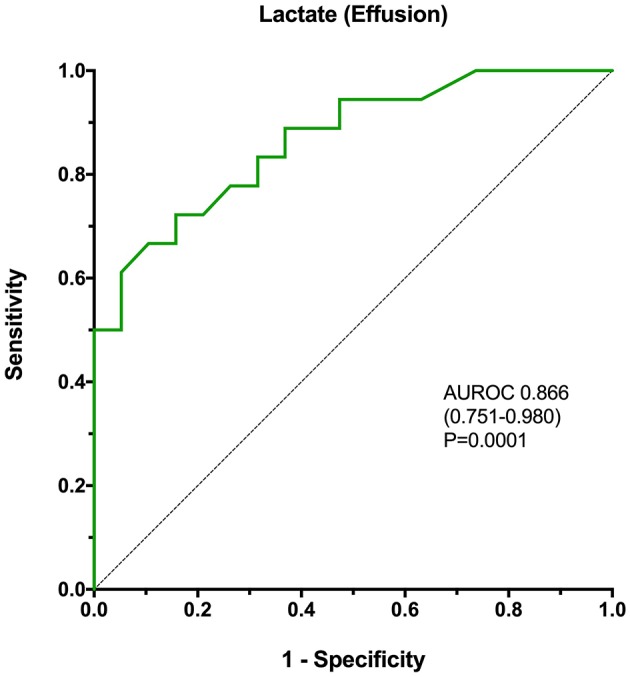
Figure 4.

A receiver operating characteristic curve analysis of the ability of effusion lactate concentration to discriminate SP from NSA in dogs, with calculation of the area under the curve, associated confidence intervals and P-value. The P-value represents the significance of the comparison of the area under the curve with the line of identity (AUROC = 0.5). AUROC, area under the receiver operating characteristic curve.
