Figure 4.
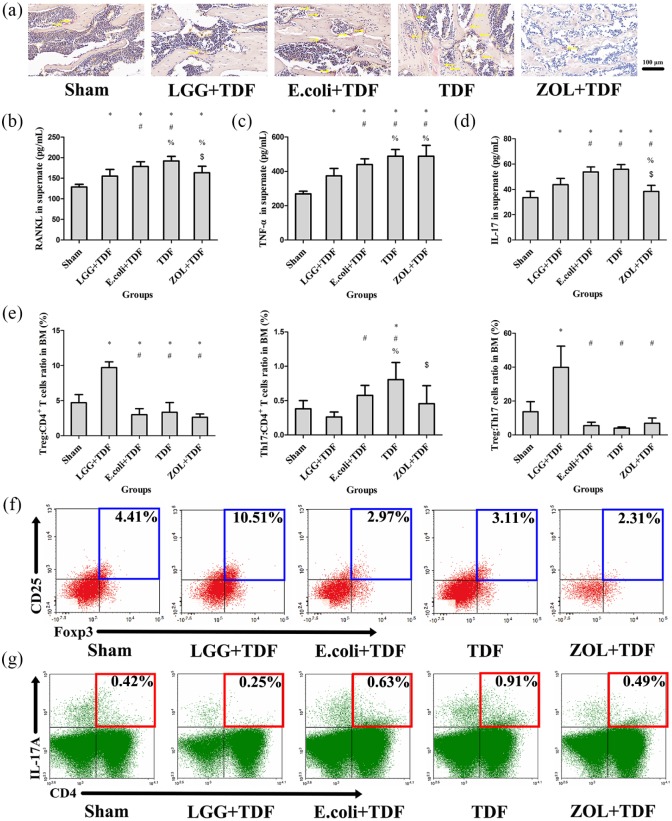
LGG administration protected against osteoclastogenesis and modulated the immune response in the BM.
(a) Representative images of bone marrow stained by TRAP in the femur (yellow arrows indicate claret-red osteoclast stained by TRAP). Scale bar = 100 μm. ELISA analysis of cell supernatant levels of RANKL (b), TNF-α (c), and IL-17 (d) (n = 10 mice per group). (e) FACS analysis on the ratios of Treg and Th17 cells in CD4+ T cell subset and the Treg:Th17 cell ratio from the BM (n = 6 mice per group). (f) Representative FACS plots of the ratio of Treg cells in CD4+ T cell subset of the BM. (g) Representative FACS plots of the ratio of Th17 cells in the CD4+ T cell subset of the BM. Data are expressed as mean ± SD. All data were normally distributed according to the Shapiro–Wilk normality test and analyzed using two-way ANOVA and post hoc tests applying the LSD correction for multiple comparisons.
*p < 0.05 compared with the Sham group.
#p < 0.05 compared with the LGG+TDF group.
%p < 0.05 compared with the E. coli+TDF group.
$p < 0.05 compared with the TDF group.
ANOVA, analysis of variance; BM, bone marrow; ELISA, enzyme-linked immunosorbent assay; FACS, fluorescence-activated cell sorting; IL-17, interleukin-17; LGG, Lactobacillus rhamnosus GG; LSD, least significant difference; RANKL, receptor activator of nuclear factor kappa-B ligand; SD, standard deviation; TDF, tenofovir disoproxil fumarate; Th17, T-helper 17 cell; TNF-α, tumor necrosis factor alpha; TRAP, tartrate-resistant acid phosphatase; Treg, regulatory T cell; ZOL, zoledronic acid.

