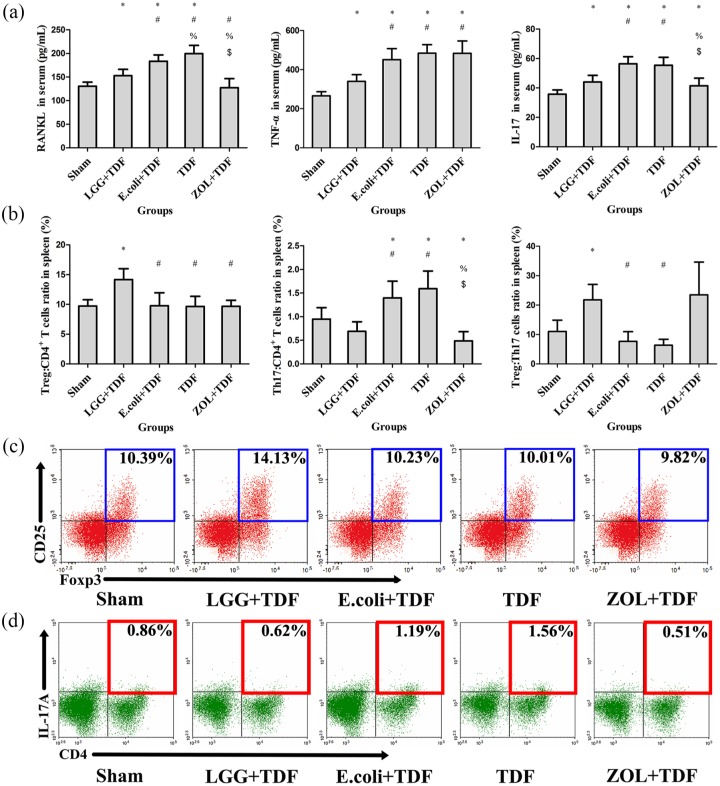
Figure 5.
LGG regulated the systemic inflammatory response.
(a) ELISA analysis of serum levels of RANKL, TNF-α, and IL-17 (n = 10 mice per group). (b) FACS analysis of the ratios of Treg and Th17 cells in the CD4+ T cell subset and the Treg:Th17 ratio in the spleen (n = 6 mice per group). (c) Representative FACS plots on ratio of Treg cells in the CD4+ T cell subset of the spleen. (d) Representative FACS plots of the ratio of Th17 cells in the CD4+ T cell subset of the spleen. Data are expressed as mean ± SD. All data were normally distributed according to the Shapiro–Wilk normality test and analyzed using two-way ANOVA and post hoc tests applying the LSD correction for multiple comparisons.
*p < 0.05 compared with the Sham group.
#p < 0.05 compared with the LGG+TDF group.
%p < 0.05 compared with the E. coli+TDF group.
$p < 0.05 compared with the TDF group.
ANOVA, analysis of variance; ELISA, enzyme-linked immunosorbent assay; FACS, fluorescence activate cell sorting; IL-17, interleukin-17; LGG, Lactobacillus rhamnosus GG; LSD, least significant difference; RANKL, receptor activator of nuclear factor kappa-B ligand; SD, standard deviation; TDF, tenofovir disoproxil fumarate; Th17, T-helper 17 cell; TNF-α, tumor necrosis factor alpha; TRAP, tartrate-resistant acid phosphatase; Treg, regulatory T cell; ZOL, zoledronic acid.

