Figure 7.
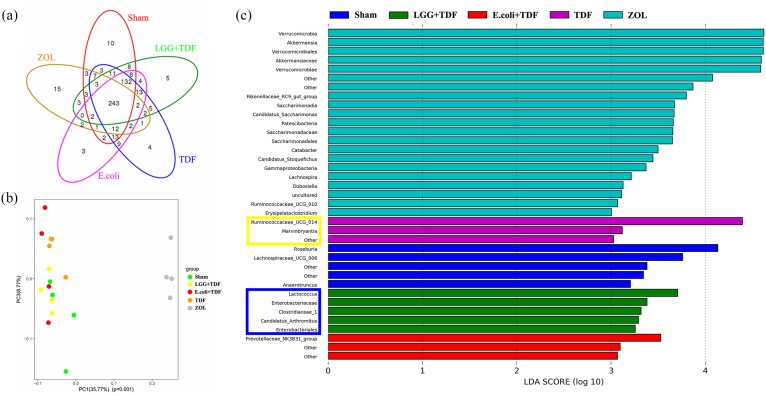
LGG reconstructed the intestinal microbial ecosystem at 8 weeks.
(a) A Venn diagram of shared and unique OTUs at 97% identity. (b) Beta diversity indices of the PCoA. PC1 and PC3 explained 35.77% and 8.77% of the variation observed, respectively (p = 0.001). (c) Histogram of the LDA scores showing significantly different microbiota compositions. The blue box represents highly abundant species in the LGG+TDF group. The yellow box represents highly abundant species in the TDF group.
LDA, linear discriminant analysis; LGG, Lactobacillus rhamnosus GG; OTUs, operational taxonomic units; PC1, ; PCoA, principal co-ordinates analysis; TDF, tenofovir disoproxil fumarate; ZOL, zoledronic acid.

