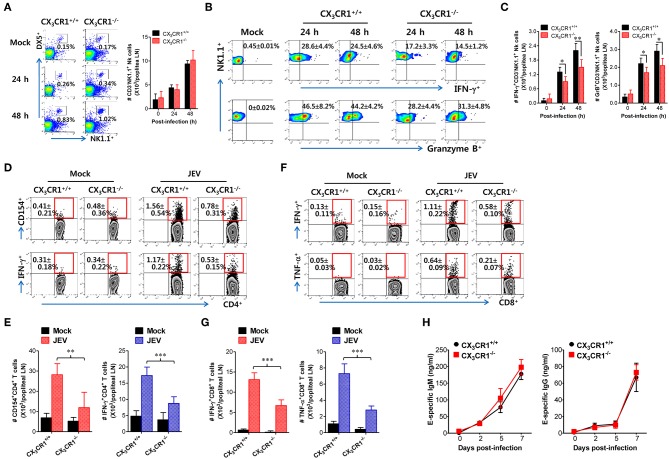
Figure 5.
CX3CR1 ablation reduced the activation of antiviral NK and JEV-specific CD4+/CD8+ T cells in peripheral lymphoid tissues. (A) NK cell number in popliteal LNs. Leukocytes were obtained from popliteal LNs of CX3CR1+/+ and CX3CR1−/− mice and used to analyze NK cells with flow cytometry at the indicated dpi. Values in dot-plots represent average ± SEM of NK1.1+DX5+ NK cells after gating on CD3-negative cells (n = 4–5). (B) NK cell activation. NK cell activation was evaluated by enumerating IFN-γ or granzyme B-producing NK cells with intracellular staining after brief stimulation of leukocytes obtained from popliteal LNs with PMA and ionomycin at 24 and 48 h pi. Values in dot-plots represent the average ± SEM of IFN-γ or granzyme B-producing cells in CD3−NK1.1+DX5+ NK cells (n = 4–5). (C) Absolute number of IFN-γ or granzyme B-producing NK cells in popliteal LNs. The total number of IFN-γ or granzyme B-producing CD3−NK1.1+DX5+ NK cells was determined by flow cytometric analysis using intracellular and surface staining at 24 and 48 h pi. (D,E) JEV-specific CD4+ T-cell responses. (F,G) JEV-specific CD8+ T-cell responses. Leukocytes were obtained from popliteal LNs from surviving CX3CR1+/+ and CX3CR1−/− mice 5 dpi and used for stimulation with JEV epitope peptide of CD4+ T cells (NS3563−574) or CD8+ T cells (NS4B215−223) for 12 or 8 h, respectively. The frequency and absolute number of JEV-specific CD4+ and CD8+ T cells were determined by intracellular CD154 and cytokine (IFN-γ and TNF-α) staining combined with surface CD4 and CD8 staining. (H) Serum levels of JEV E protein-specific IgM and IgG. Levels of JEV E protein-specific IgM and IgG in sera (n = 7–8) were determined by conventional ELISA using sera collected from surviving mice at 7 dpi. Values in representative dot-plots denote average ± SEM percentage of indicated cell population. Bar charts show the average ± SEM of values derived from at least three independent experiments (n = 4–5). *p < 0.05; **p < 0.01; and ***p < 0.001 compared between CX3CR1+/+ and CX3CR1−/− mice at indicated dpi.

