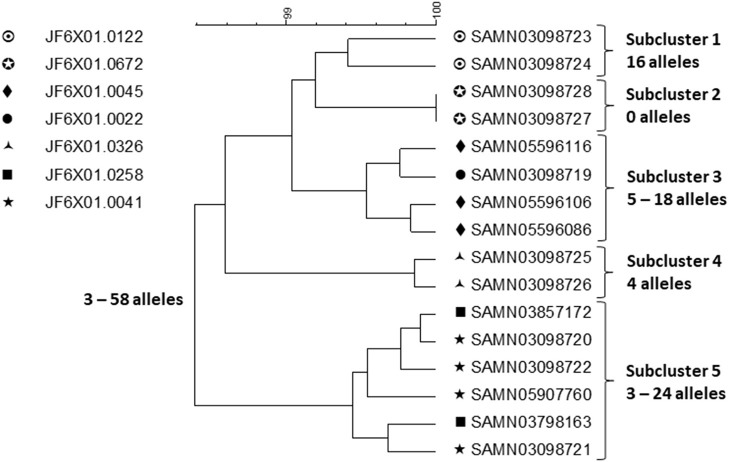
Figure 2.
cgMLST UPGMA tree of a representative sample of sequences of Salmonella ser. Heidelberg isolates displaying the full WGS diversity and representing the seven PFGE patterns from the outbreak associated with chicken produced by Company A. The range of allele differences are indicated at the branches of the tree and subclusters to the right of the tree.

