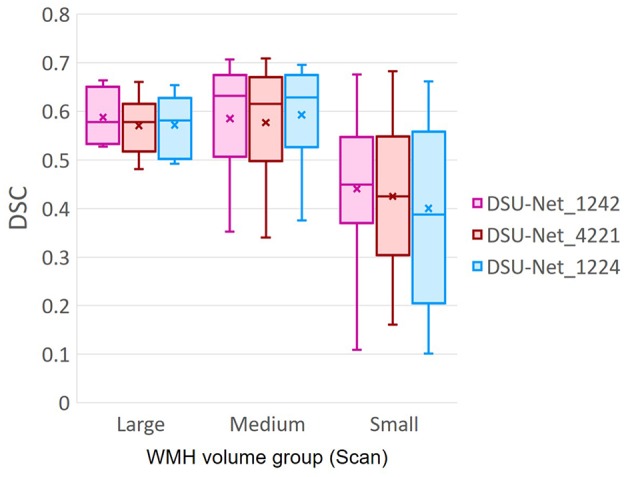
Figure 11.

DSC score of three different Dilated Saliency U-Net groups based on WMH volume in MRI scans. The group information is described in Table 3. “x” and bar at the middle of box indicate mean and median each. Bottom and top of each box means the first and third quartile.
