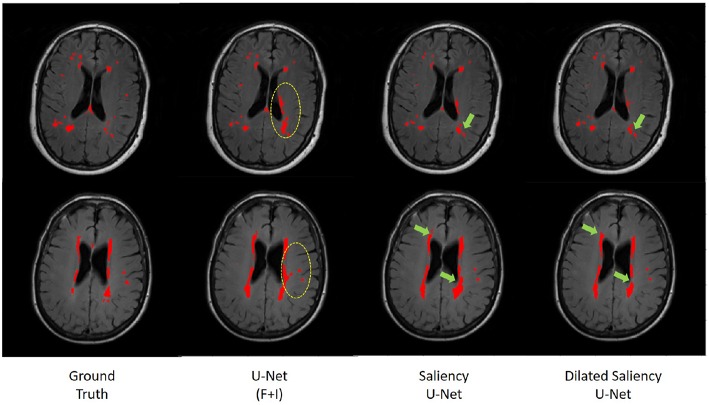
Figure 9.
Comparison of WMH segmentation results from U-Net(F+I), Saliency U-Net and Dilated Saliency U-Net. Yellow circles indicate false positive results by U-Net(F+I). These false positive results are eliminated in the results from Saliency and Dilated Saliency U-Net. Green arrows are pointing to locations where boundaries are segmented in more detail by Saliency and Dilated Saliency U-Net.

