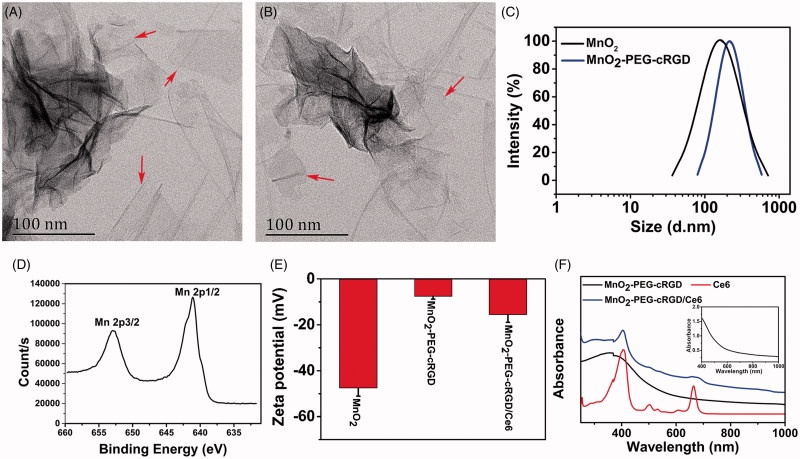
Figure 1.
TEM images of (A) MnO2 and (B) MnO2-PEG-cRGD nanosheets. (C) DLS size distribution of MnO2 and MnO2-PEG-cRGD nanosheets. (D) Mn 2p XPS spectra for MnO2 nanosheets. (E) Zeta potential of MnO2, MnO2-PEG-cRGD, and MnO2-PEG-cRGD/Ce6 (n = 3). (F) UV-Vis spectra of Ce6, MnO2-PEG-cRGD, and MnO2PEG-cRGD/Ce6. Inset: UV-Vis spectra of MnO2-PEG-cRGD nanosheets between 400 and 1000 nm.

