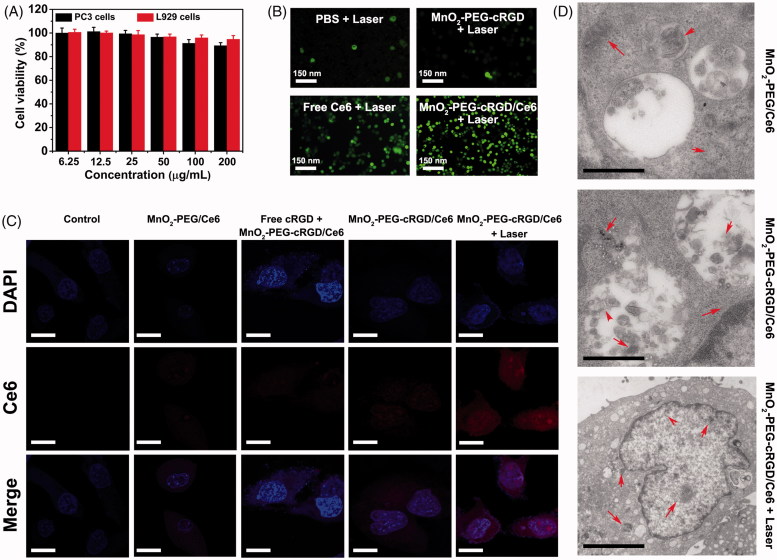
Figure 4.
(A) Relative viability of PC3 and L929 cells after incubation with MnO2-PEG-cRGD (25, 50, 100, 200, 300, and 500 µg mL − 1) for 24 h. (B) CLSM of intracellular 1O2 generation after PC3 cells were treated with PBS, MnO2-PEG-cRGD, free Ce6, and MnO2-PEG-cRGD/Ce6 under laser illumination. (C) CLSM of PC3 cells treated with MnO2-PEG/Ce6 and MnO2-PEG-cRGD/Ce6 (relative Ce6 = 5.0 μg/mL) for 4 h with or without laser illumination (Blue fluorescence is associated with DAPI; red fluorescence is expressed by released Ce6). Scale bars = 50 μm. (D) Bio-TEM images of PC3 cells incubated with MnO2-PEG/Ce6 and MnO2-PEGcRGD/Ce6 with or without laser irradiation. Scale bar: 1 μm.

