
FIGURE 5.
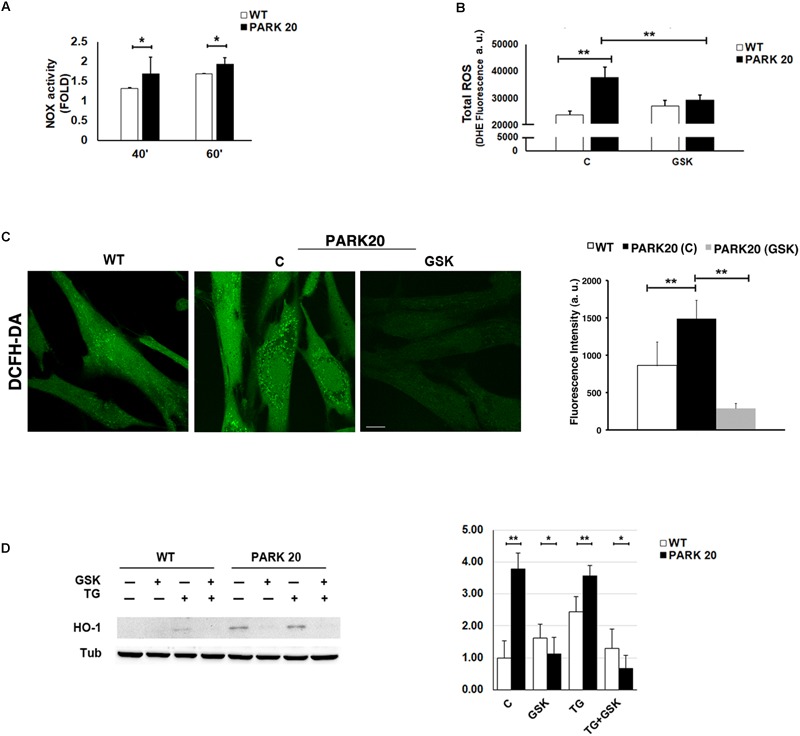
Oxidative stress is increased in PARK20 fibroblasts. (A) NADPH oxidase (NOX) activity assay performed in HDF cells (WT) and PARK20 fibroblasts as reported in the methods. Histogram shows the relative fold change of NOX activity expressed as mean ± SD. Results were obtained from three independent experiments. (B,C) ROS quantification was carried out by using DHE (B) or DCFH-DA (C) fluorescent probes. HDF cells (WT) and PARK20 fibroblasts were untreated (C) or treated for 2 h with 1μM GSK2606414 (GSK) and then processed for DHE or DCFH-DA fluorescence quantification as detailed in the methods section. Histograms show mean values ± SD of DHE or DCFH-DA fluorescence expressed as arbitrary unit (a. u.) and calculated on three independent experiments. Scale bar 10 μm. (D) Immunoblot detection of HO-1 and densitometric analysis of three independent experiments. Starved HDF (WT) and PARK20 cells were either untreated (C) or treated for 2 h with 1 μM GSK2606414 (GSK) or 500 nM Thapsigargin (TG) alone (GSK and TG respectively) or in combination (TG + GSK) as aforementioned. α-Tubulin (TUB) was used as loading control. Representative immunoblotting is shown. Histogram shows the relative fold induction of HO-1 expression in the treated samples compared to the control samples. Results are expressed as mean values ± SD. ∗p ≤ 0.05, ∗∗p ≤ 0.01, Student’s t-test.