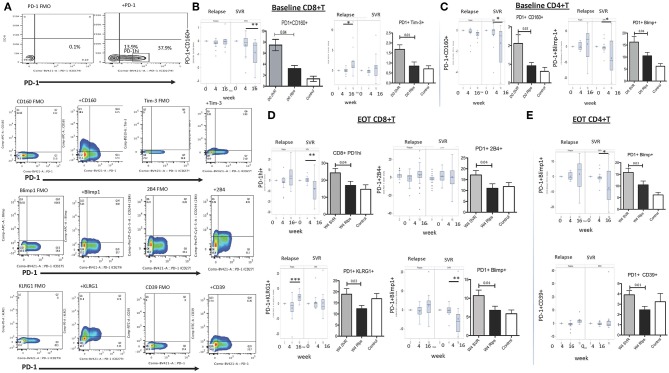
Figure 1.
Expression of inhibitory receptors on global T lymphocytes in DAA treated SVR and Relapse groups. (A) Gating strategy for identifying T cells expressing PD-1 and other inhibitory receptors using appropriate FMO controls. For B-E, left panels in each figure show change in indicated subset's frequency relative to baseline (0) after treatment initiation (week 4 and 16) in relapse and SVR groups; right panels show grouped averages in SVR, relapse (Rlps) and healthy Controls. (B) Baseline (D0) PD-1+CD160+ and PD-1+Tim-3+ CD8+ T cells, (C) D0 PD-1+CD160+, PD-1+Blimp-1+ CD4+ T cells, (D) Week 4 (W4 or EOT) PD-1hi, PD-1+2B4+ PD-1+KLRG1+, and PD-1+Blimp-1+ CD8+ T cells and (E) Week 4 (W4 or EOT) PD-1+CD39+, PD-1+Blimp-1+ CD4+ T cells in SVR, relapse and healthy controls. P-values were determined by 1 Way ANOVA with Bonferroni's-Dunn's post-hoc test for pairwise multiple comparisons, p ≤ 0.05 is significant. Controls, healthy control; D0, baseline; W4, week 4/End of treatment (EOT); W16, 12 weeks after EOT. *p ≤ 0.05, **p ≤ 0.01, ***p ≤ 0.001.

