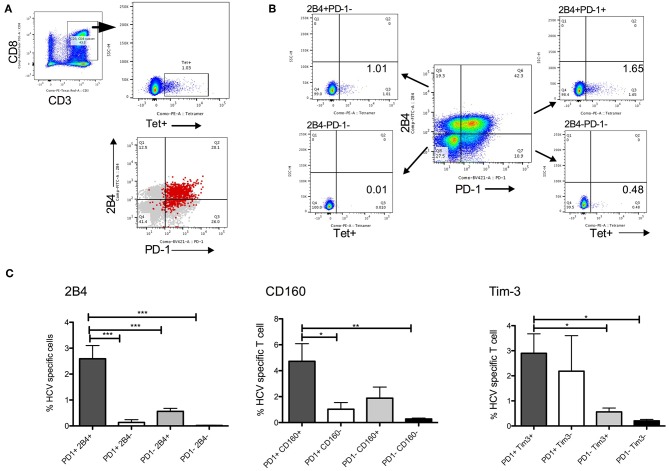
Figure 4.
HCV specific CD8+ T cells in PD-1+ CD8 T cell subsets. (A) Gating strategy to detect HCV tetramer (tet+) CD8+ T cells. PD-1 and 2B4 expression among global (gray) and HCV tet+ (red) CD8+ T cells show most tet+ cells in PD-1+2B4+ subset. (B) Example of CD8 T cell subsets distinguished by PD-1 and 2B4 expression (2B4+PD-1-, 2B4-PD-1-, 2B4-PD-1+, 2B4+PD-1+) show relative abundance of HCV tet+ cells in four subsets. (C) Frequency of HCV tet+ T cells in CD8 T cells subsets distinguished by PD-1/2B4, PD-1/CD160 and PD-1/Tim-3 show average tet+ cells in different subsets (N = 5 HCV HLA-A*02 patients). Statistical significances determined by 1 Way ANOVA with Turkey's Multiple Comparison Test, *p ≤ 0.05, **p ≤ 0.01, ***p ≤ 0.001.

