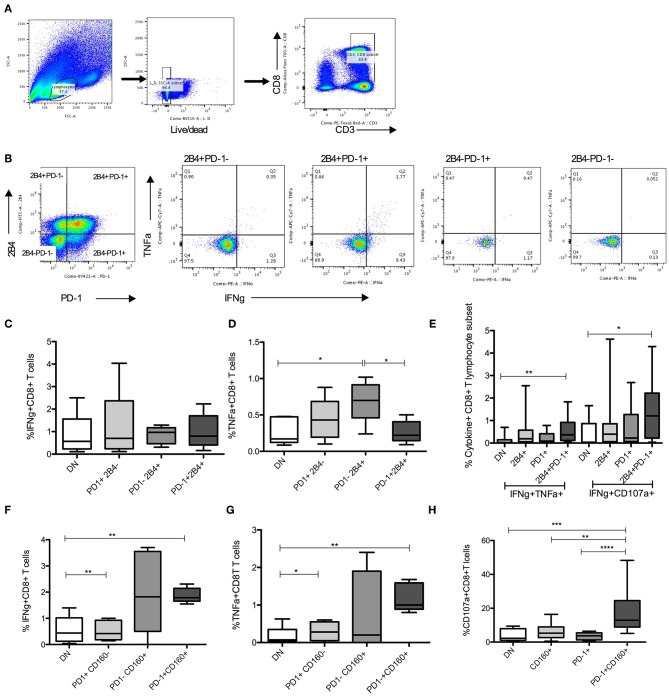
Figure 5.
HCV specific cytokines in PD-1+ CD8 T lymphocyte subsets. (A,B) Gating strategy to identify live CD8+ lymphocyte subsets identified by PD-1 and 2B4 expression. (C–E) Frequencies of HCV specific cytokine (IFNγ+, TNFα+, CD107a+) producing cells among 4 distinct subsets of CD8+ T cells based on PD-1 and 2B4 expression (DN: PD-1-2B4-; 2B4+, PD-1+, and 2B4+PD-1+). (F–H) Frequencies of cytokine positive cells among 4 subsets of CD8+ T cells distinguished based on PD-1 and CD160 expression (DN: PD-1-CD160-; CD160+, PD-1+, and PD-1+CD160+) in response to HCV peptide stimulation. Statistical significances determined by 1 Way ANOVA with Turkey's Multiple Comparison Test, *p ≤ 0.05, **p ≤ 0.01, ***p ≤ 0.001, ****p ≤ 0.0001.

