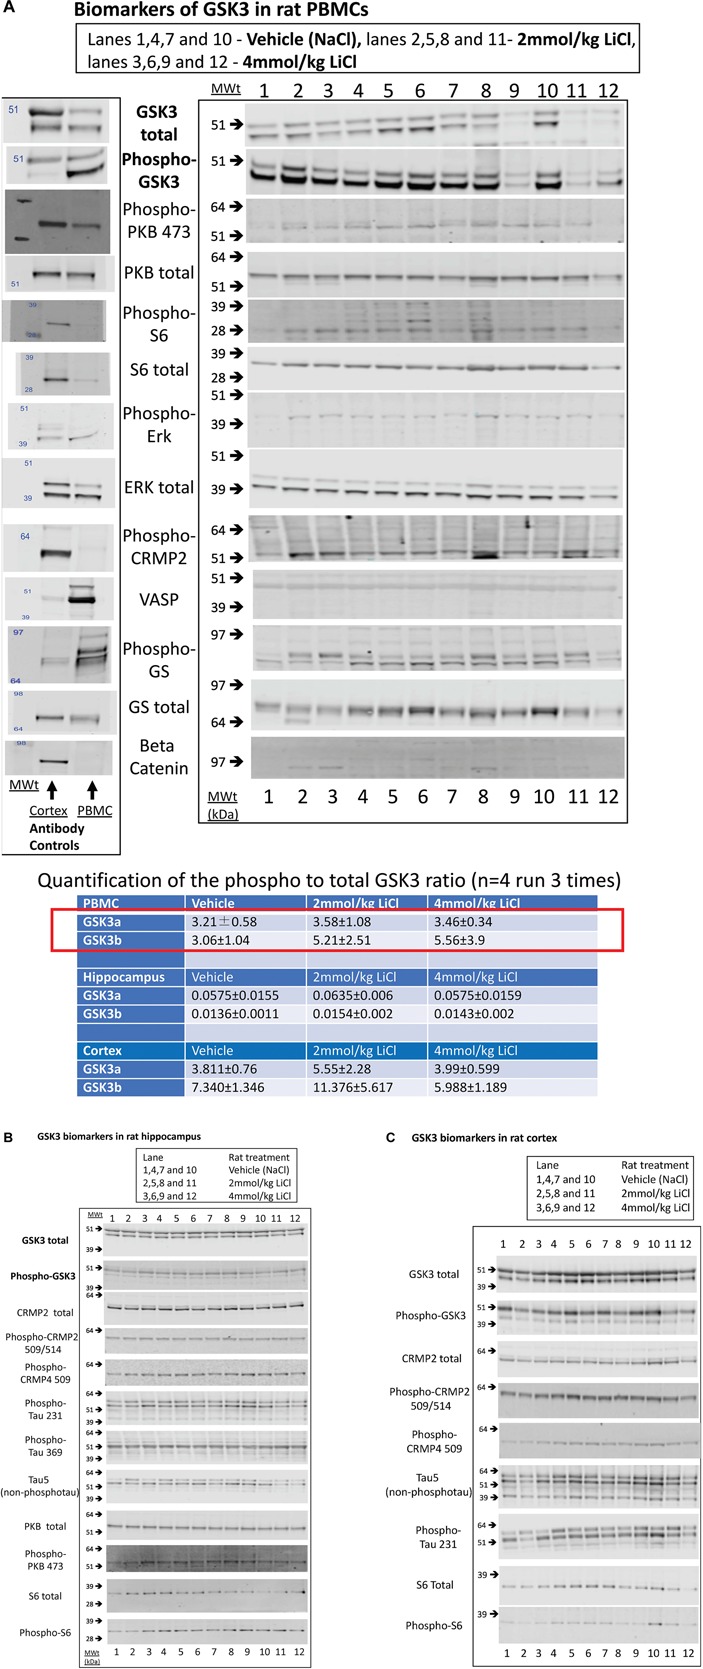
FIGURE 3.

Biomarkers of GSK3 in rat tissues following lithium injection. Rats were given an i.p. injection of vehicle or lithium chloride as detailed in section “Materials and Methods,” and tissues isolated 3 h later. Representative examples of Western blots of rat protein lysates isolated from (A) rat PBMCs, (B) Hippocampus, or (C) Cortex, are provided using the antibodies stated. In (A), we also provide a comparison of vehicle treated rat PBMC lysate with rat brain cortex lysate with every antibody as evidence for the utility of each antibody (antibody control). The ratio of expression of GSK3 phosphorylation at the N-terminal inhibitory site to the overall isoform expression was quantified from the images as detailed in section “Materials and Methods,” and is provided for each tissue (±SD) in the table inserted into A. The red box highlights the major biomarker changes in response to lithium, although only the P-GSK3β-total GSK3β ratio was significantly increased by lithium (p < 0.05, student t test).
