
Figure 3.
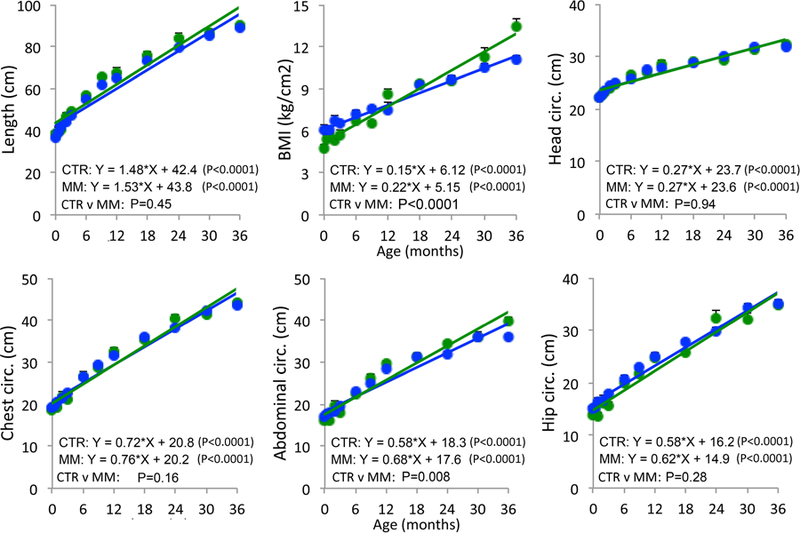
Female offspring morphometrics from birth through age 3 years in controls (CTR- blue; N = 13–20) and mismatch (MM- green; N = 4–15). Sample sizes details for each timepoint given in Table 2. Mean ± SEM.
Official websites use .gov
A
.gov website belongs to an official
government organization in the United States.
Secure .gov websites use HTTPS
A lock (
) or https:// means you've safely
connected to the .gov website. Share sensitive
information only on official, secure websites.
Female offspring morphometrics from birth through age 3 years in controls (CTR- blue; N = 13–20) and mismatch (MM- green; N = 4–15). Sample sizes details for each timepoint given in Table 2. Mean ± SEM.