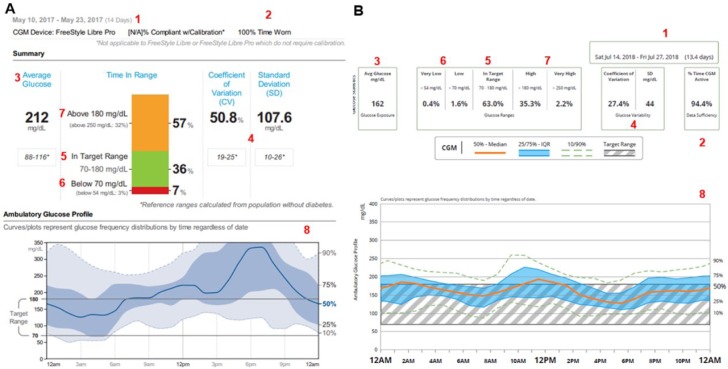
Figure 1.
Ambulatory glucose profile (AGP) information and time in ranges glucometrics with Libre View (A) and Dexcom Clarity (B) software. AGP profile and time in ranges glucometrics can be interpreted similarly regardless of the software. Basic information tools include:
1. Number of days analyzed. Ideally at least 10-14 days are needed.52
2. Time of sensor wear. Ideally as close to 100%, but at least ⩾70%.56
3. Glucose average or glucose exposure to have a sense of the glucose management indicator (GMI).60
4. Standard deviation and coefficient of variation to determine glycemic variability and increase risk for hypoglycemia.53,54
5. Time spent in target range. Ideally close to 70%.56
6. Time spent in hypoglycemia. Ideally <3%.49
7. Time spent in hyperglycemia.
8. AGP profile with median, 25-75% percentile, and 10-90% percentile to identify areas of concern with recurrent trends and patterns.

