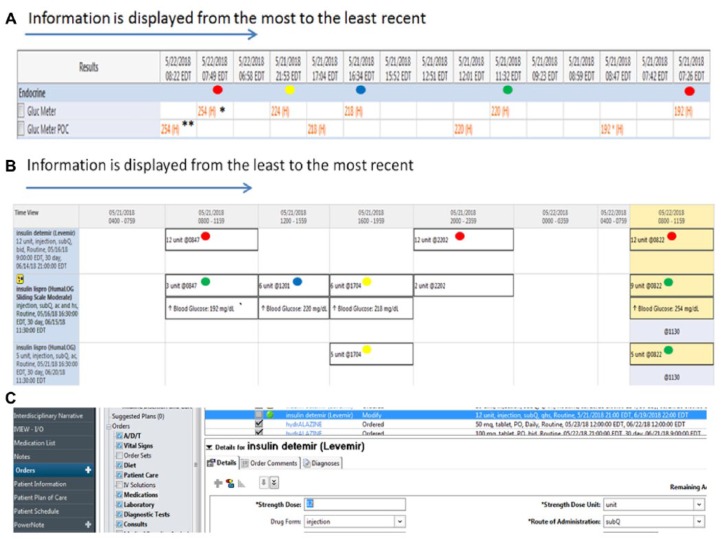
Figure 1.
Example of an EHR glucose and insulin data display and provider interaction.
(a) Display of glucose data. In this table, blood glucose values stored in the EHR are displayed from the most to the least recent. Repeated (duplicated) numbers shown in the table (example, glucose level 254 marked with asterisks) represent point-of-care (POC) results** that are manually recorded in the EHR and electronically downloaded from the glucose meter* to the computer. The same concept applies to other repeated values in the table. Providers need to be aware that in some instance this may occur because these repeated values could be incorrectly interpreted as different results and this may lead to inadequate decisions on insulin adjustment. The colored dots (not part of EHR display but shown here to facilitate interpretation of glucose control in relation to insulin treatment) indicate the different times within a 24-hour period that glucose values need to be interpreted to assess the effect of previously administered insulin doses. The times include before breakfast-fasting: red dot, lunch: green dot, supper: blue dot, and prior to bedtime: yellow dot. In addition, this interpretation typically needs to be extended beyond 24 hours for recognition of glycemic patterns to have informed decision making for subsequent insulin adjustments . Providers using this EHR would need to decide which data to use (eliminating duplicate values), and mentally organize the data on their own, using the time stamps above each value, without having visual cues such as the colored dots added.
(b) Display of insulin administration record. This chart illustrates a typical EHR medical administration record, which is found in a separate section of the EHR (requiring the physician to click away from the data screen above), and contains information about the insulin regimen scheduled and the doses received. The colored dots (not part of this EHR) shown next to the insulin doses correspond to the glucose values in Figure 1a. This particular display of information shows insulin treatment scheduled or received before breakfast-fasting: red dot, lunch: green dot, supper: blue dot, and prior to bedtime: yellow dot. Clinicians need to interpret the glycemic response to such doses at various times of the day. Each mealtime glucose status-insulin schedule pairing requires an independent interpretation. This is because the dose of insulin given at the time of a meal will determine the glucose level prior to the next meal. Likewise, basal insulin will influence fasting control (red dot), which in turn, will determine how the basal dose may be adjusted. The regimen shown is applicable for patients who are scheduled to receive meals. The approach and thought process will differ for those who are not being fed, who are receiving enteral or parenteral nutrition, or who require intravenous insulin.
(c) Implementing a glucose management plan. After adequate interpretation of glucose results (Figure 1a) and confirmation of insulin doses administered (Figure 1b), providers then need to exit out of the EHR views above and subsequently access the medication list or orders menu to make changes to the insulin doses as required (Figure 1c).

