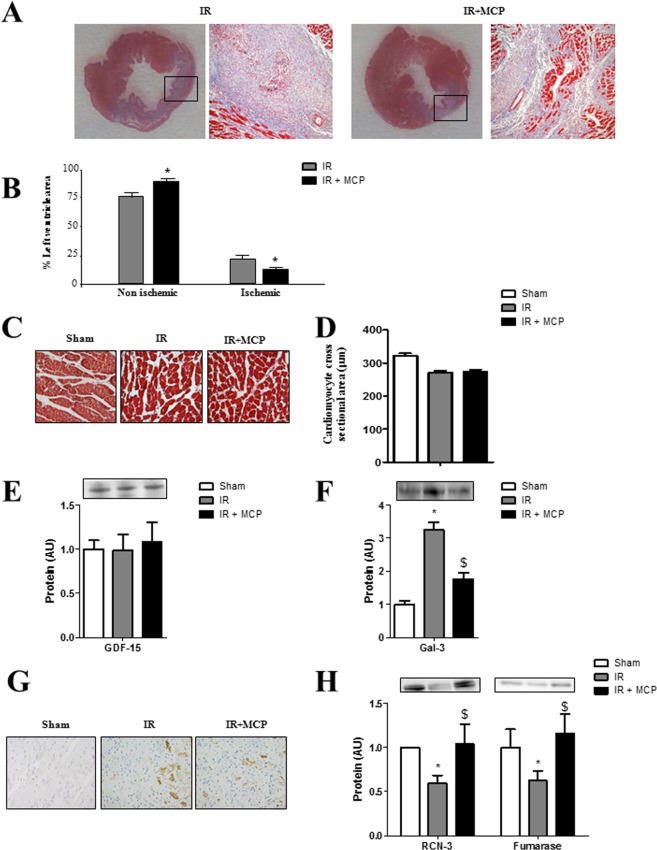
Figure 2.
Myocardial cross sections of IR and IR + MCP-treated rats and quantification of Gal-3 expression. (A) Representative microphotographs of myocardial sections were stained with Masson trichrome and imaged at 4x and 40x power fields. (B) Ischemic areas were selected and quantified using computed-based image analysis software. (C,D) Cardiomyocyte cross sectional area was measured in myocardial sections. (E) Quantification of GDF-15 protein expression. (F) Quantification of Gal-3 protein levels in sham, IR and IR + MCP rats. (G) Representative microphotographs imaged at 40x of the ischemic zone stained for Gal-3. (H) Quantification of Gal-3 downstream proteins RCN-3 and fumarase. Histogram bars represent the mean ± SEM of each group of animals (n ≥ 12 per group) in arbitrary units or as a percentage of staining normalized to HPRT, 18 s and β-actin or stain-free gel for cDNA and protein respectively. *p < 0.01 vs. Sham, $, p < 0.01 vs.IR.

