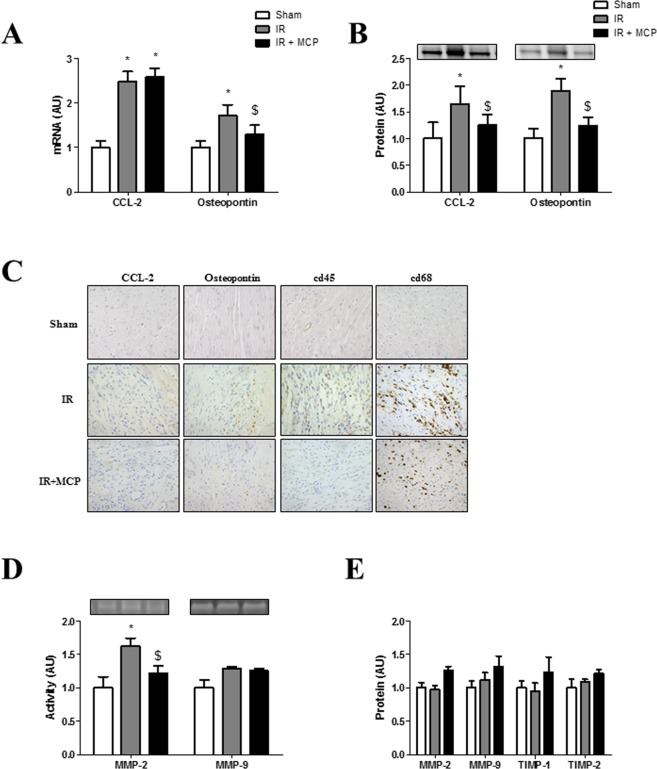
Figure 3.
Effects of pharmacological inhibition of Gal-3 on inflammation and cardiac MMPs. (A) Quantification of CCL-2 and osteopontin in hearts at mRNA and (B) protein levels. (C) Representative microphotographs of myocardial sections stained for CCL-2, osteopontin, cd45 and cd68. (D) MMP-2 and MMP-9 activities were performed by zymography. (E) Quantification of MMP-2, MMP-9, TIMP-1 and TIMP-2 in hearts from rats at protein levels. Histogram bars represent the mean ± SEM of each group of animals (n ≥ 12 per group) in arbitrary units or as a percentage of staining normalized to HPRT, 18 s and β-actin or stain-free gel for cDNA and protein respectively. Magnification 40x. *p < 0.01 vs. Sham, $, p < 0.01 vs.IR.

