Figure 1.
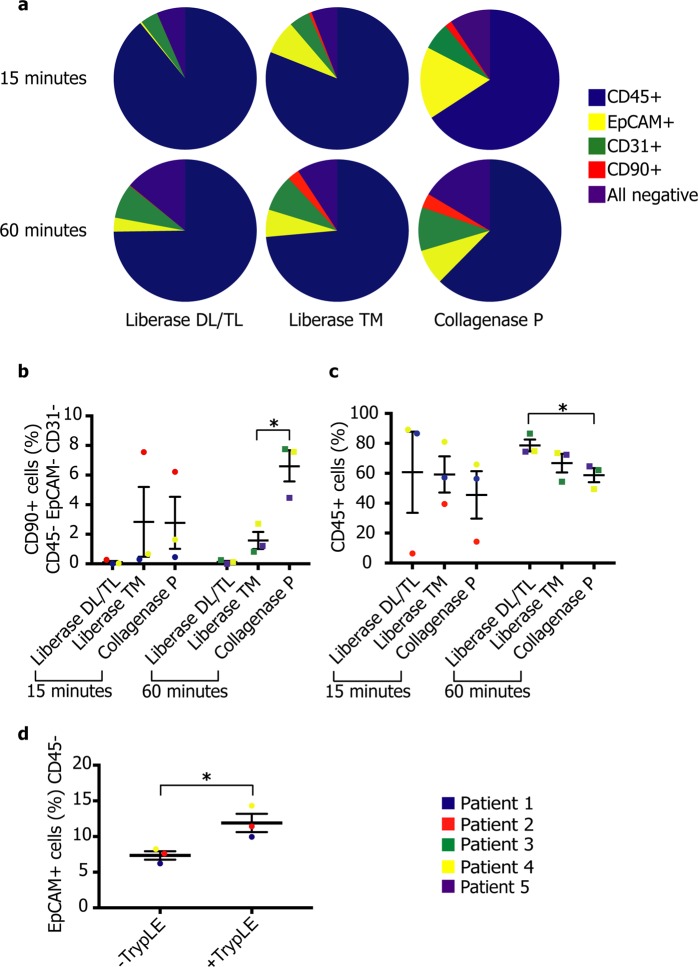
Disaggregation enzymes and incubation times have a significant impact on stromal cell isolation. (a) Representative pie charts for each disaggregation time and enzyme cocktail. (b–d) Dot plots showing cell-type fractions isolated by different disaggregation procedures across human patient samples (n = 5): fibroblasts (CD45-EpCAM-CD31-CD90+: b), Immune cells (CD45+: c), and epithelial cells (CD45-EpCAM+: d; *p < 0.05, unpaired two-tailed t-test). Further data associated with this figure can be found in Figs S1–4.

