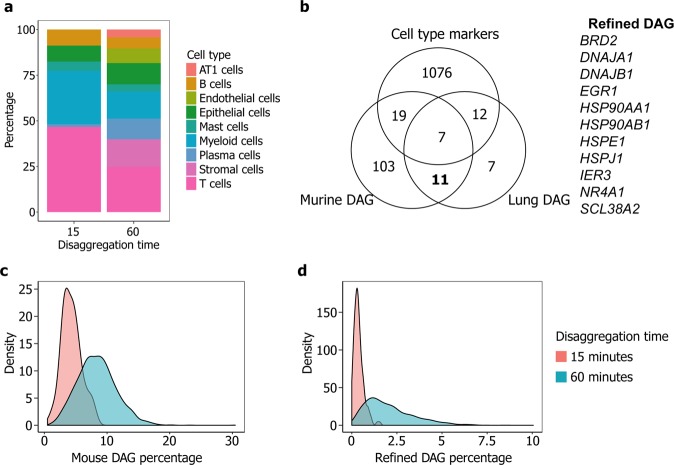
Figure 3.
Longer tissue disaggregation enables detection of more cell types, with concomitant increases in disaggregation-associated changes in gene expression. (a) Stacked barplot showing cell type fractions generated by disaggregation for 15 and 60 minutes. (b) Venn diagram showing overlap between murine disaggregation-associated signature5 (Murine DAG), human disaggregation-associated signature (Lung DAG) and cell type markers. The 11 genes comprising the refined signature (highlighted in bold) are shown on the right. (c) and (d) Density plots showing percentage expression of the murine disaggregation signature (c) and the refined disaggregation signature (d), in human lung tissue disaggregated for 15 and 60 minutes. Further data associated with this figure can be found in Fig. S6.

