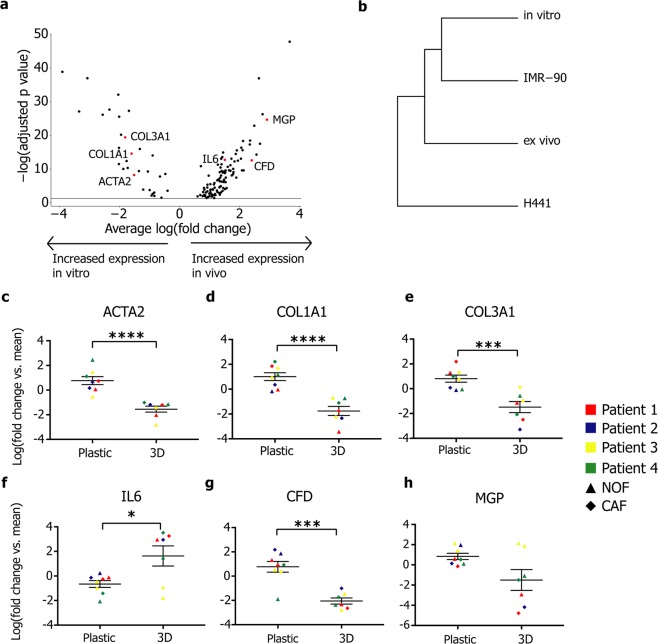
Figure 4.
In vitro culture alters fibroblast transcriptomes. (a) Volcano plot of genes differentially expressed (log(fold change) >1) between in vitro and ex vivo fibroblasts. Genes selected for analysis at real time-PCR are highlighted in red. (b) Dendrogram showing unsupervised hierarchical clustering of average gene expression for the four cell populations. (c–g) Dot plots showing changes in gene expression (real-time PCR) in primary lung fibroblasts following culture on plastic or in 3D (collagen:Matrigel gels): (c) ACTA2, (d) COL1A1, (e) COL3A1, (f) IL6, (g) CFD and (h) MGP. Gene expression levels expressed as the log2 fold change relative to mean expression across all samples (n = 4). ▲: NOF, ♦: CAF. *p < 0.05, ***p < 0.001, ****p < 0.0001, unpaired or Welch’s t-tests. Further data associated with this figure can be found in Figs S7–S9.

