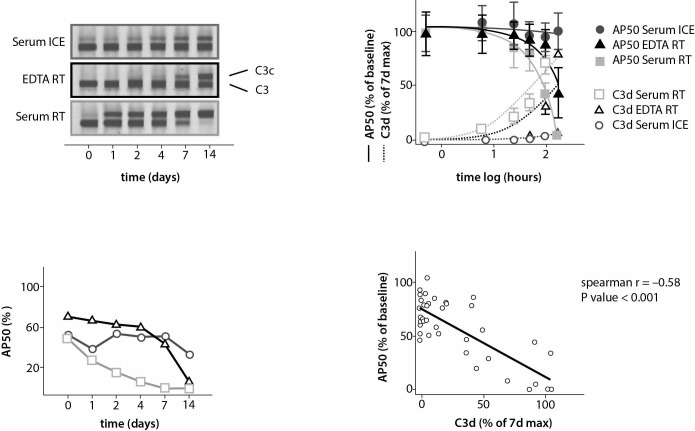
Figure 2.
Comparison of AP50 activity (bottom left panel) with C3c formation (upper left panel) by immunofixation using poly-clonal antibodies against C3c in serum (light grey) and EDTA plasma (black) at RT versus in serum on ice (dark grey) from a single healthy volunteer over time. Non-linear fitting of logarithmically transformed time and normalized-to-maximum AP50 and C3d values (upper right panel) in serum on ice (dark grey closed and open circles) vs. RT (light grey closed and open squares) and EDTA plasma at room temperature (black closed and open triangles). Symbols and error bars represent the mean and standard error of mean of three healthy volunteers. Spearman correlation and linear regression analyses (lower right panel): each data point compares individual normalized-to maximum AP50 (Y-axis) and C3d (X-axis) values of all available time points of serum at RT and EDTA plasma from three healthy volunteers. RT - room temperature.

