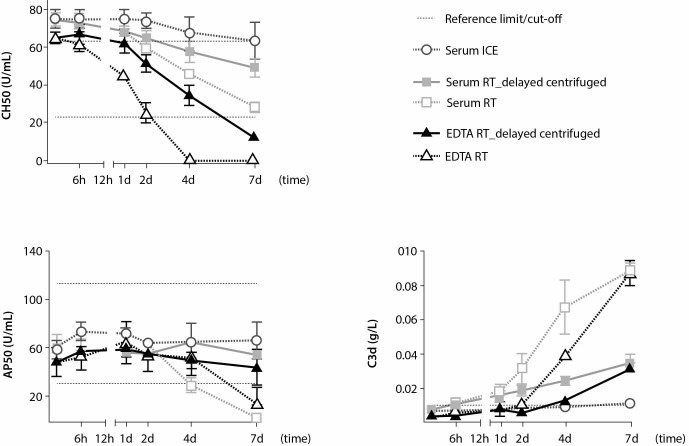
Figure 3.
Influence of centrifugation timing on CH50, AP50 and C3d kinetics in serum on ice (dark grey) vs. RT (light grey) and EDTA plasma at RT (black). Symbols and error bars represent the mean and standard error of mean of two healthy volunteers. Kinetics in serum (squares) and EDTA plasma (triangles) when centrifugation is performed before incubation (open symbols connected by dotted lines) compared to centrifugation after indicated incubation times (filled symbols connected by solid lines). Reference intervals and cut-off are indicated as dotted lines. RT - room temperature. AP50 - alternative pathway complement activity. CH50 - total haemolytic (or classical) complement activity.

