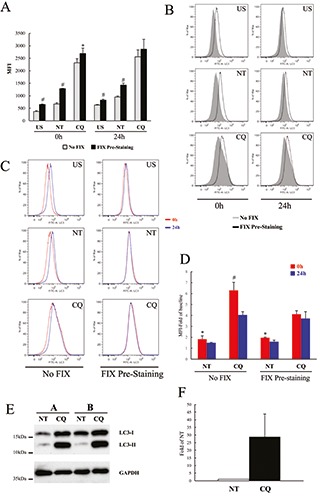
Figure 2.

LC3 levels measured introducing a fixation step in THP-1 cells. A) Cells were treated for 24 h with and CQ (80 μM) or left untreated (NT) and analysed by flow cytometry using the FlowCellect Kit, following either the manufacturer’s instructions (No Fix; grey columns) or introducing cellular fixation right after cell permeabilisation (Fix Pre-staining; black columns); MFI of samples not stained with LC3 antibodies (US) were also measured; the same samples were analysed by flow cytometry both right after the end of the kit’s procedure (0 h) and one day after (24 h) as indicated; data are expressed as average ±SD (n=6); #P<0.005 Fix-US vs No Fix-US; Fix-NT vs No Fix-NT; *P<0.05 Fix-CQ vs No Fix-CQ. B) Cells were treated and analysed as in A; representative flow cytometry histograms of LC3 levels of THP-1 cells analysed with either No Fix (grey filled lines) or Fix Pre-staining (black lines). C) Cells were treated and analysed as in A. Representative flow cytometry histograms of cells, either No Fixed or Pre-staining fixed as indicated, analysed at 0 h (red line) or 24 h (blue line) after the end of staining procedure. D) Data represent MFI of LC3 levels normalized to baseline MFI of unstained cells, stimulated as indicated and analysed right after the end of the kit’s procedure (0 h; red columns) and one day after (24 h; blue columns). Data are expressed as average ±SD (n=6); #P<0.005; CQ-0h vs CQ-24h; *P<0.05 NT-0h vs NT-24h. E) A representative immunoblotting analysis of LC3 in THP-1 cells treated as in A. GAPDH levels were used as loading control. F) Quantification of the ratio of LC3-II to GAPDH band intensities obtained by immunoblotting analysis, as in E, and expressed as average ±SD (n=6).
