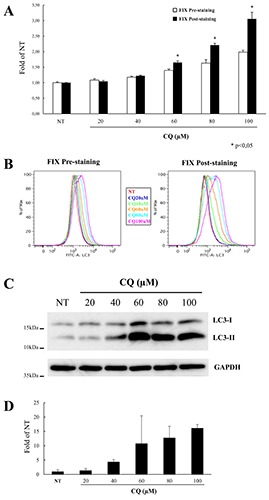
Figure 3.

LC3 accumulation induced by different doses of CQ in THP-1 cells. A) Cells were treated for 24 h with different doses of CQ, as indicated, or left untreated (NT) and analysed by flow cytometry using the FlowCellect Kit in which a fixation step was introduced either before (Fix Pre-staining; white columns) or after LC3 labelling (Fix Post-staining; black columns); data represent MFI of LC3 levels normalized to that of NT cells analysed using the pre-staining fixation protocol and expressed as average ±SD (n=4); *P<0.05 Fix-Pre-staining vs Fix-Post-staining. B) Representative flow cytometry histograms of LC3 levels of THP-1 cells treated and analysed as in A. C) A representative immunoblotting analysis of LC3 in THP-1 cells treated as in A; GAPDH levels were used as loading control. D) Quantification of the ratio of LC3-II to GAPDH band intensities obtained by immunoblotting analysis, as in C, and expressed as average ±SD (n=4).
