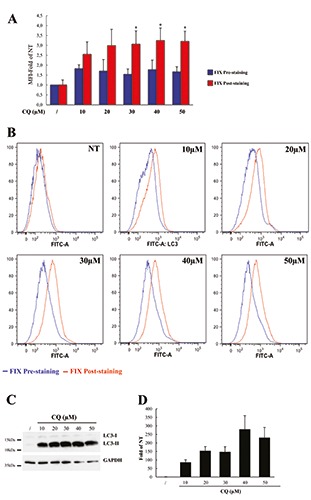
Figure 4.

LC3 accumulation induced by different CQ treatments in human PBMC. A) Human PBMC were isolated from healthy donors and treated with different doses of CQ, as indicated, or left untreated (NT) for 24 h; LC3 levels were measured by flow cytometry using the FlowCellect Kit in which a fixation step was introduced either before (Fix Pre-staining; blue columns) or after LC3 labelling (FIX Post-staining; red columns); data represent MFI of LC3 levels normalized to MFI of untreated cells analysed using the pre-staining fixation protocol and expressed as average ±SD (n=4); *P<0.05 Fix-Pre-staining vs Fix-Post-staining. B) Flow cytometry histograms show representative intracellular LC3 expression of cells unstimulated (NT) or stimulated with different doses of CQ as indicated for 24 h and analysed for LC3 levels using the pre-staining (blue lines) or the post-staining (red lines) procedure. C) A representative immunoblotting analysis of LC3 in THP-1 cells treated as in A; GAPDH levels were used as loading control. D) Quantification of the ratio of LC3-II to GAPDH band intensities obtained by immunoblotting analysis, as in D, and expressed as average ±SD (n=4).
