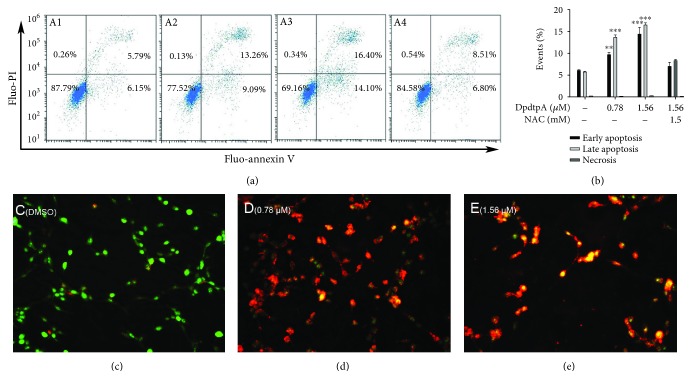
Figure 2.
A DpdtpA induced apoptosis in the CT26 cell after 24 h posttreatment as detected by flow cytometry and EtBr/AO staining assay. Flow cytometry analysis: (A1) DMSO; (A2) 0.78 μM DpdtpA; (A3) 1.56 μM DpdtpA; (A4) 1.56 μM DpdtpA+NAC (1.5 mM). (b) Quantification analysis of apoptosis and necrosis induced by DpdtpA. The data were from two measurements. Microscopical analysis by EtBr/AO stains: (c) DMSO; (d) 0.78 μM DpdtpA; (e) 1.56 μM DpdtpA. Green, orange, and red fluorescence indicates live, apoptotic, and dead cells, respectively. Images were captured by fluorescence microscope (Nikon ECLIPSE TiE) at ×10 magnification. AO: acridine orange; EtBr: ethidium bromide. The measurements were performed thrice from different field of view (AO/EtBr stains); the quantification analysis of apoptosis by flow cytometry was from two measurements.

