Figure 4.
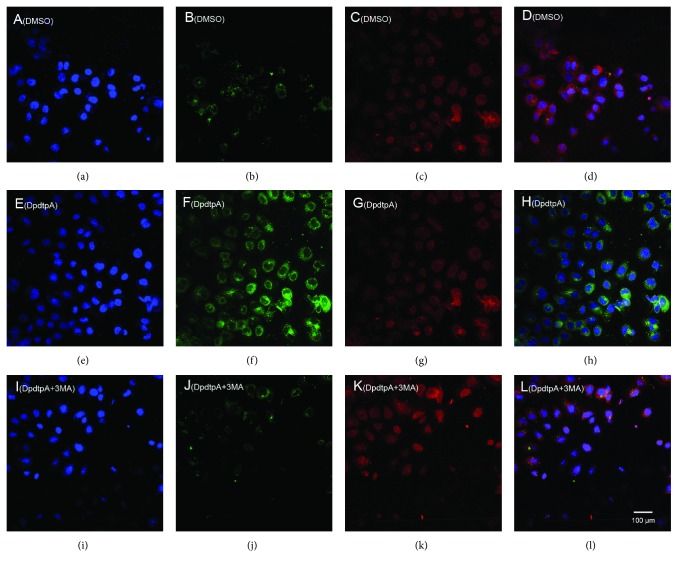
DpdtpA induced ferritin autophagy (ferritinophagy). The nuclei stained by DAPI in blue, ferritin labeled in red; LC3 labeled in green. (a-d) Control group: (a) nuclei in blue; (b) ferritin in red; (c) LC3 in green; (d) merge of ferritin with LC3. (e-h) DpdtpA-treated group: (e) nuclei in blue; (f) ferritin in red; (g) LC3 in green; (h) merge of ferritin with LC3. (i-l) DpdtpA combined with 3-MA group: (i) nuclei in blue; (j) ferritin in red; (k) LC3 in green; (l) merge of ferritin with LC3. The experiments were performed thrice. Scale bar: 100 μm.

