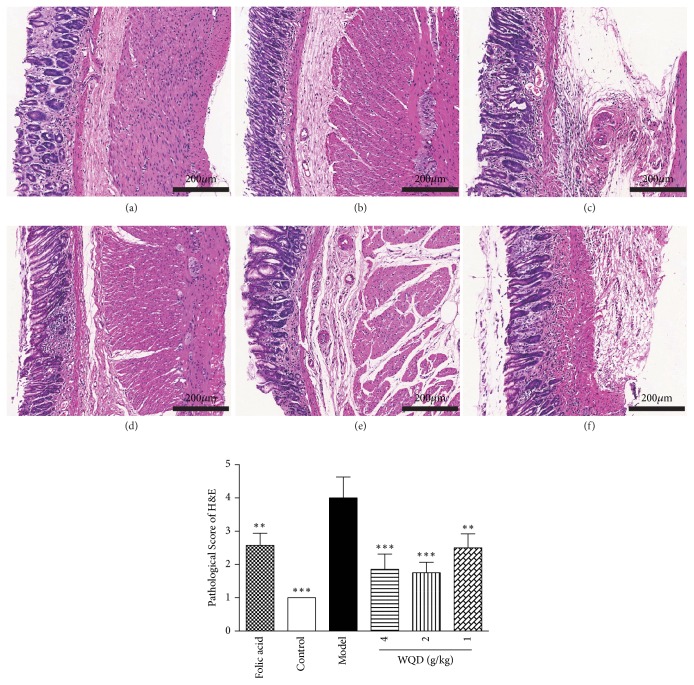
Figure 2.
The representative pathology of gastric tissues in each group (H&E staining, 100× magnifications). (a) Folic acid group, (b) control group, (c) model group, (d) WQD 4 g/kg group, (e) WQD 2 g/kg group, and (f) WQD 1 g/kg group. Values were expressed as mean ± SD (n=6-8/group). Data were analyzed by one-way ANOVA assay. ∗∗p < 0.01; ∗∗∗p < 0.001 vs model group.

