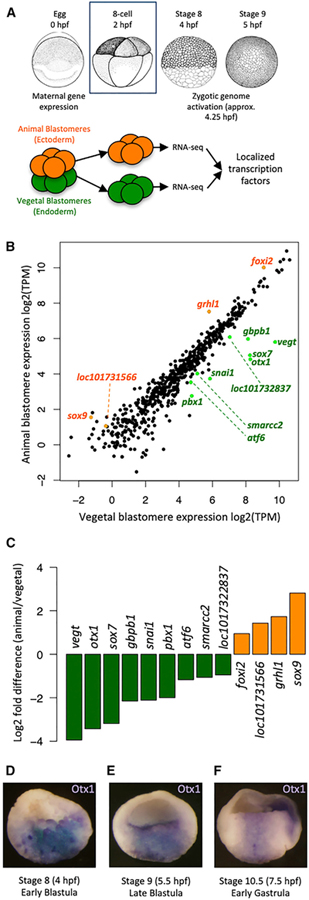
Figure 1. Screen for Core Maternal Endodermal TFs.
(A) Dissection of six to eight 8-cell stage embryos in 3 biological replicates at 2 h post-fertilization (hpf) to separate animal and vegetal blastomeres for RNA sequencing.
(B) Log2-transformed transcripts per million (TPM) expression of TFs in animal and vegetal blastomeres. Differentially expressed TFs are highlighted in green (vegetal) or orange (animal).
(C) Log2-transformed fold change (animal over vegetal) of expression levels of localized TFs.
(D–F) In situ hybridization showing otx1 expression (cells in blue) in the vegetal mass cells (presumptive endoderm) during early blastula (D), late blastula (E), and early gastrula (F).

