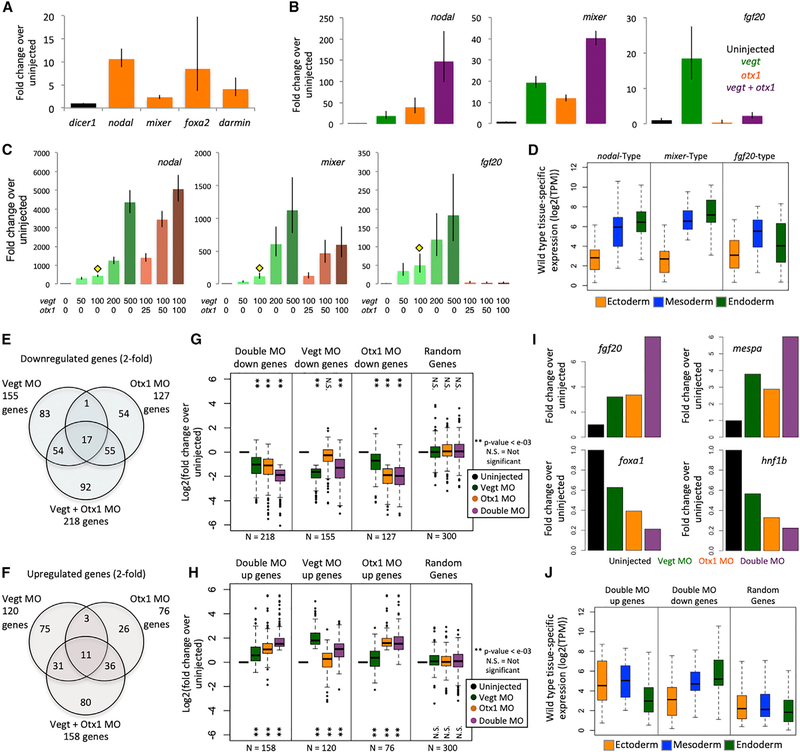
Figure 2. Vegt and Otx1 Are Dual Function TFs in the Endoderm.
(A) Ectopic expression of otx1 in animal caps shows the induction of endodermal genes by RT-qPCR. dicer1 was used for normalization. Shown is a single representative biological replicate out of 3. Error bars represent variation from 3 technical replicates.
(B) Single and combined ectopic expression of 100 pg otx1 mRNA and 100 pg vegt mRNA shows synergistic and antagonistic co-regulation by RT-qPCR. dicer1 was used for normalization. Shown is a single representative biological replicate out of 3. Error bars represent variation from 3 technical replicates.
(C) Combinatorial ectopic expression of vegt and otx1 in the animal cap using dosage titration to assay for similarly co-regulated genes by RT-qPCR. Yellow diamond indicates the subthreshold concentration of vegt, with which titrating doses of otx1 mRNA are co-injected. RNA doses are expressed in picograms. dicer1 was used for normalization. Shown is a single representative biological replicate out of 3. Error bars represent the variation from 3 technical replicates.
(D) Two biological replicates from (C) were subjected to RNA-seq. Genes that are similarly co-regulated as nodal, mixer, and fgf20 were identified by correlating gene expression in TPM using the Pearson correlation coefficient. Plotted is the spatial expression pattern in the gastrula stage of genes that are positively co-regulated (nodal type and mixer type) or negatively co-regulated (fgf20-type) by vegt and otx1.
(E and F) Vegt and Otx1 morpholinos were injected independently or together to vegetal masses at the 1-cell stage, and vegetal masses were assayed by RNA-seq at stage 10 in biological duplicates. The Venn diagrams show genes that are downregulated (E) or upregulated (F) in different conditions, where regulation is identified as a >2-fold change in gene expression compared to uninjected control.
(G and H) Fold change expression of downregulated (G) or upregulated (H) genes in the RNA-seq datasets in TPM over uninjected control, along with a set of 300 randomly sampled genes. Significance was determined using the Student’s t test.
(I) Expression of mesodermal (fgf20, mespa) genes and endodermal (foxa1, hnf1b) genes in the morpholino RNA-seq experiment in TPM.
(J) Gastrula stage spatial expression of genes that are downregulated and upregulated in the double morpholino experiment, along with a set of 300 randomly sampled genes. TPM is in log2 scale.

