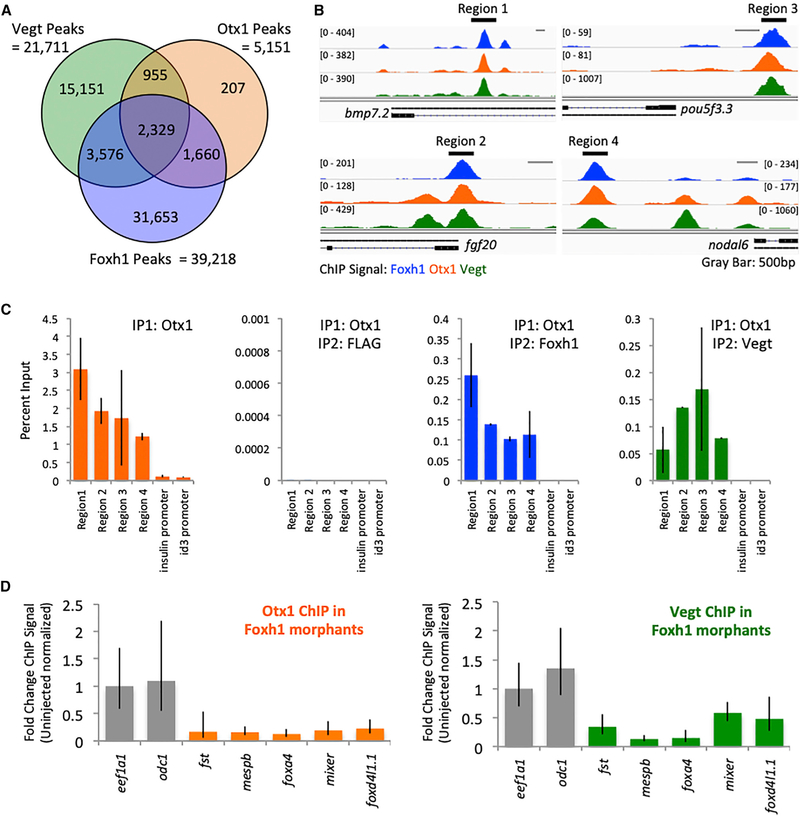
Figure 4. Otx1, Vegt, and Foxh1 Form an Assembly in the Chromatin.
(A) Venn diagram of Otx1, Vegt, and Foxh1 biologically reproducible peak overlaps.
(B) Genome browser view of Otx1, Vegt, and Foxh1 binding, highlighting 4 regions of peak overlaps near the bpm7.2, pou5f3.3, fgf20, and nodal6 genes.
(C) Sequential ChIP-qPCR using anti-Otx1 followed by anti-FLAG, anti-Vegt, or anti-Foxh1 antibody in regions of peak overlap highlighted in (B). ins and id3 promoters were used as negative controls. The error bars represent variation from 3 technical replicates.
(D) Foxh1 morpholino KD followed by Otx1 or Vegt ChIP-qPCR performed on stage 8 embryos. eef1a1 and odc1 promoters were used as negative control. Shown is a single representative biological replicate. The error bars represent the variation from 3 technical replicates.

