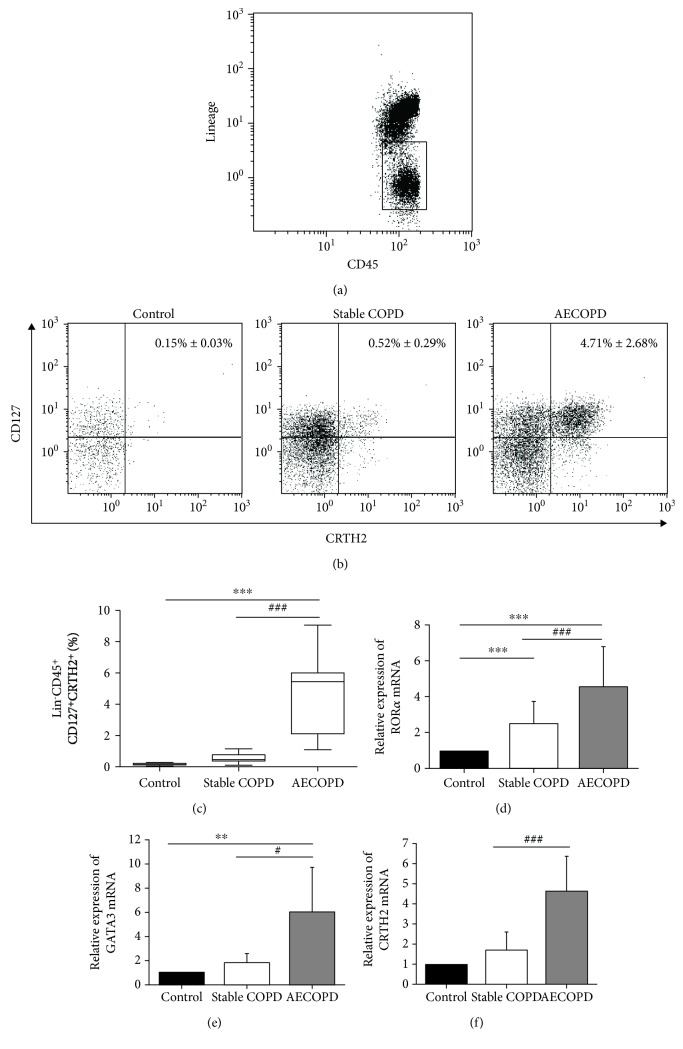
Figure 2.
Levels of ILC2 and the related transcription factors of the three groups. Flow cytometry was performed. (a–c) Percentage of ILC2s in the peripheral blood of control, stable COPD group, and AECOPD group. The mRNA levels of (d) RORα, (e) GATA3, and (f) CRTH2 were tested by RT-PCR. Data were normalized to control group and represented as mean ± SD. Compared with the control group, ∗∗P < 0.01, ∗∗∗P < 0.001. Compared with the stable COPD group, #P < 0.05, ###P < 0.001.

