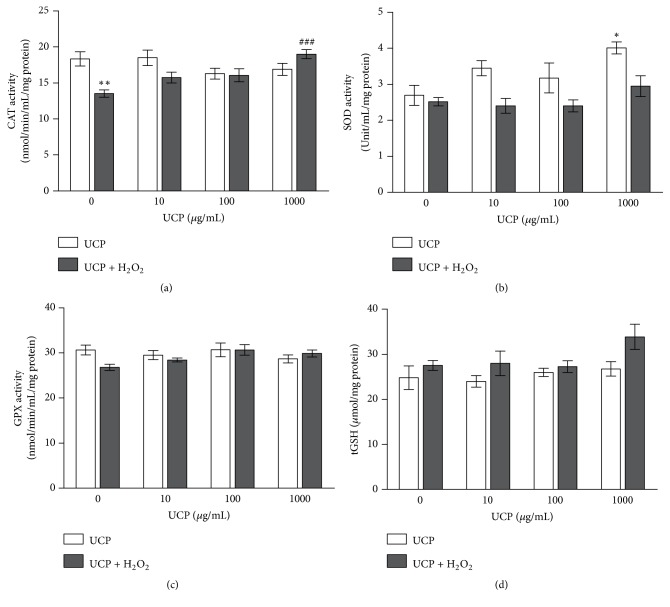
Figure 6.
The effect of H2O2 and UCP on antioxidant enzyme activity and GSH levels in EA.hy926. (a) CAT activity; (b) SOD activity; (c) GPX activity; (d) GSH levels. Data are shown as mean ± SEM. ∗ p < 0.05, ∗∗ p<0.01, and ∗∗∗ p<0.001 when compared with vehicle treated group. ### p < 0.001 when compared with 1 mM H2O2 treated group.

