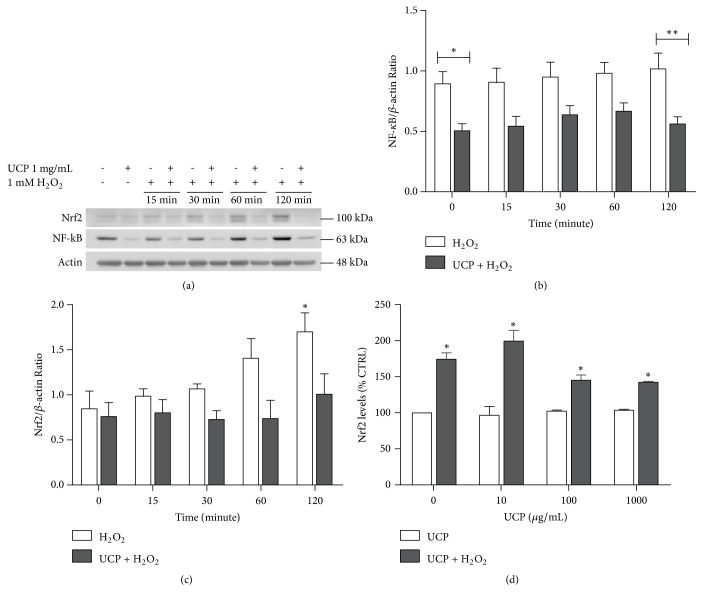
Figure 8.
The effect of UCP and H2O2 on the nuclear transcription factor Nrf2 and NF-κB levels. (a) Representative western blot protein bands at the time frame of 0 to 120 min. (b) Calculated nuclear NF-κB/β-actin protein ratios. (c) The Nrf2/ β-actin ratio. (d) The amounts of Nrf2 protein determined by ELISA. Data are presented as mean ± SEM. ∗ p < 0.05 and ∗∗ p < 0.01 when compared with vehicle treated group (CTRL).

