
Figure 2.
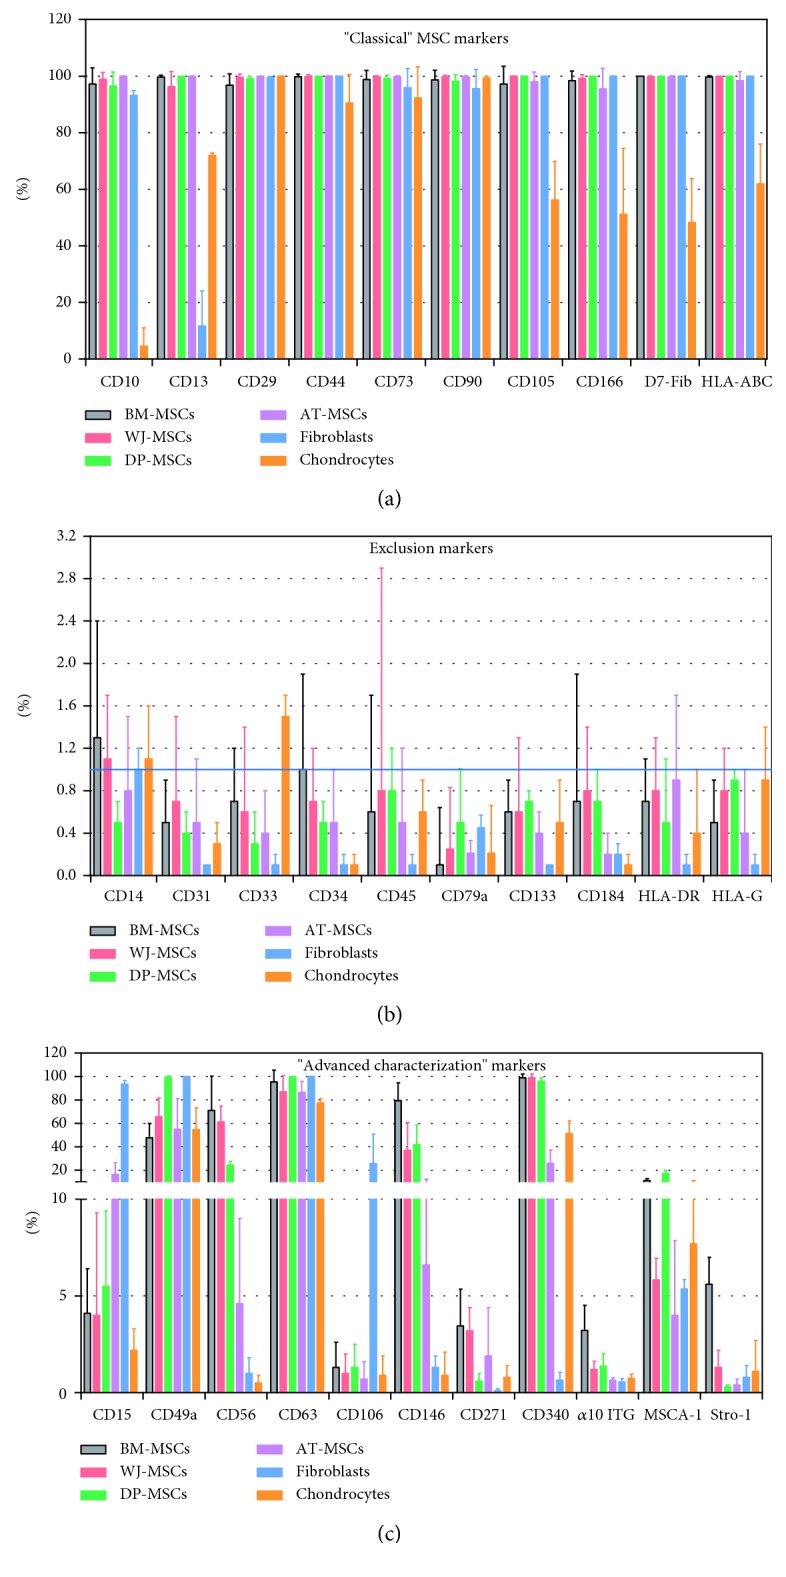
Comparative immunophenotypic analysis of MSCs, fibroblasts, and articular chondrocytes cultivated under serum-free conditions. A total of 31 cell markers were analyzed at passage 1, by using multicolor flow cytometry. (a) “Classical” MSC markers, (b) exclusion markers, and (c) “advanced characterization” markers (n = 8 for BM-MSCs, n = 5 for DP-, WJ-, and AT-MSCs, and n = 3 for fibroblasts and chondrocytes). The blue line indicates the 1% threshold. Error bars: mean ± SD.