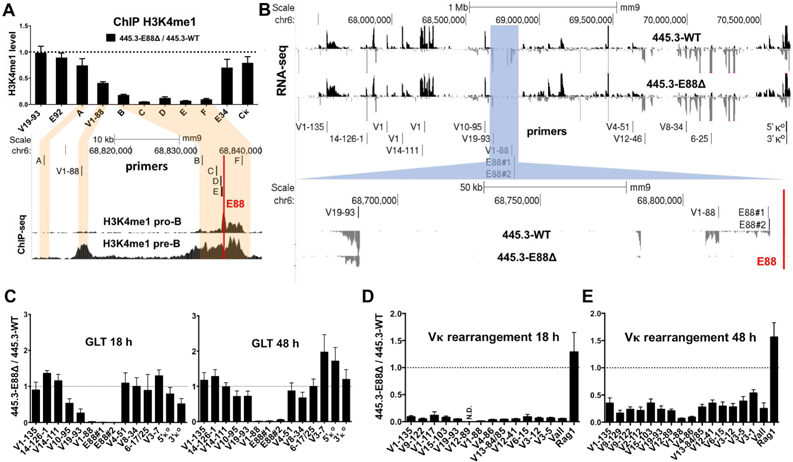
Figure 2. E88 controls H3K4me1 deposition, GLT, and rearrangement in an inducible pro-B cell line.

(A, top) H3K4me1 ChIP qPCR analysis was performed in 445.3-WT or 445.3-E88∆ Abl cell lines. Results are expressed as the E88∆ / WT ratio of the relative level of H3K4me1. (A, bottom) H3K4me1 ChIP-seq in RAG−/− pro-B cells and RAG−/−.Igh-Tg+ pre-B cells and the location of primers used for ChIP qPCR shown above. (B, top) RNA-seq data from STI571-stimulated 445.3-WT and 445.3-E88∆ cells. Reads are directionally mapped, with sense strand on top in black and antisense below in gray. (B, highlighted blue and bottom) Region around E88 is shown. Red line indicates the location of E88 in (A, B). (C) GLT was assessed at 18 and 48 hours post STI571 stimulation by qPCR with primers along the Igκ locus (location shown in B). (D, E) Vκ rearrangement was assessed in 445.3-WT or 445.3-E88∆ cells. RNA was harvested at 18 and 48 hours post STI571 stimulation and analyzed by qPCR. Data from Vκ rearrangement and GLT were normalized with GAPDH and expressed as E88∆ / WT ratio. N.D.= not detected in the E88∆ samples. Data is the average of at least 3 independent biological replicates from 3 independent E88∆ clones ± SEM. RNA-seq is the representative of 2 independent experiments.
