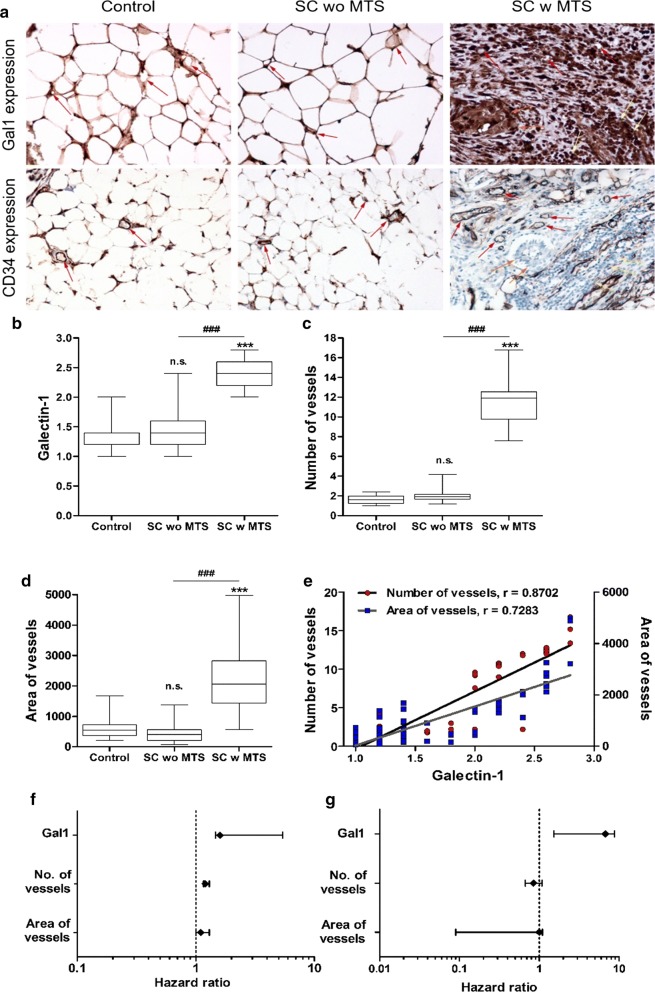
Fig. 5.
High positive correlation between Gal1 expression and number of vessels, and area of vessels. a Expression of Gal1 (upper panel) and CD34 (lower panel) in endothelium (moderate expression- red arrows) in control (left), SC wo MTS (serous carcinoma without omental metastasis, moderate expression; middle), and SC w MTS (serous carcinoma with omental metastasis, high expression; right). In SC w MTS, Gal1 expression is shown in endothelium (red arrows), cancer cells (orange arrows) and stromal lymphocytes infiltration (yellow arrows). b Significantly higher Gal1 expression in SC w MTS group compared to control and SC wo MTS. Gal1 expression is represented as an intensity score, as described by Chen et al. [19]. c A significant increase in the number of vessels and d area of vessels were found in SC w MTS group compared to the other groups. The vessels were counted according to Weidner’s method described in “Materials and method” section [28]. e Very high correlation between Gal1 and number, and area of vessels, indicating a potential proangiogenic role for Gal1. f Univariate and g multivariate hazard ratios of Cox analysis of predictive patients’ survival. Photographs were taken using a Nikon Eclipse 50i. ***p < 0.001 vs control group, ###p < 0.001 vs SC wo MTS. n.s. denotes not significant. Magnification: ×200

