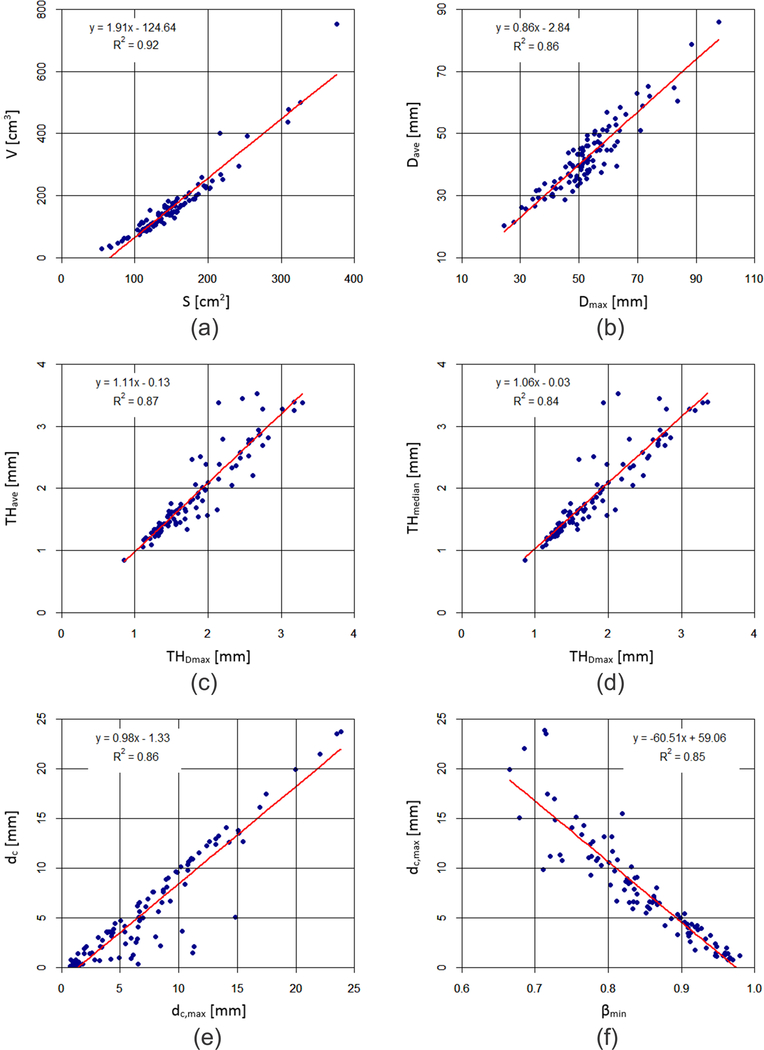
Figure 5:
Correlations between (a) V and S, (b) Dave and Dmax, (c) THDmax and THave, (d) THDmax and THmedian, (e) dc and dc_max, and (f) βmin and dc,max. For each pair, the correlation coefficient is high (|r| > 0.9 or R2 > 0.81), such that one of the two indices can be ignored in the regression analyses described in Tables 2 and 3 with the superscripts a, b, c, d, e and f.

