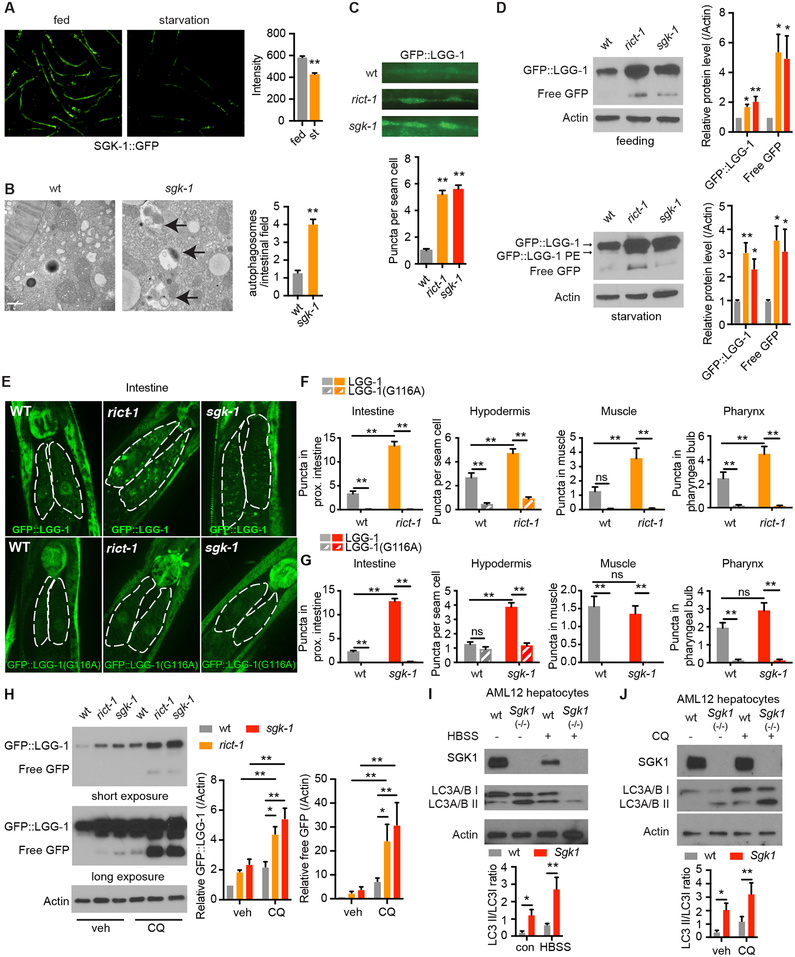
Figure 1. mTORC2 Regulates Autophagy in Both C. elegans and Mouse Hepatocytes.
(A) SGK-1::GFP detected by fluorescence microscopy, scale bar: 200 μm. (n = 67 worms for control and 69 for starvation, student’s t-test).
(B) C. elegans sgk-1 mutants show increased autolysosomes (arrows) by electron microscopy versus wild type (wt), scale bar: 500 nm. (n = 59 and 87 for wt and sgk-1, respectively student’s t-test).
(C) Increased autophagy levels in seam cells of rict-1 and sgk-1 mutants by GFP::LGG-1 puncta (n = 70, 73 and 71 for wt, rict-1, and sgk-1, respectively, one-way ANOVA).
(D) Western blotting of LGG-1::GFP, LGG-1::GFP-PE and cleaved free GFP protein levels in fed and starved rict-1 and sgk-1 mutants (n = 8 biological replicates, one-way ANOVA).
(E) Fluorescence microscopy of GFP::LGG-1 puncta in the proximal intestinal cells of rict-1 and sgk-1 mutants expressing wildtype LGG-1 or lipidation defective mutant LGG-1(G116A).
(F and G) Quantification of GFP::LGG-1 puncta in the intestine, muscle, hypodermis and pharynx of rict-1 (F) and sgk-1 (G) mutants expressing LGG-1 or LGG-1(G116A). (n > 25 cells analyzed per group, two-way ANOVA).
(H) GFP::LGG-1 and free GFP levels in wild type, rict-1, and sgk-1 mutants under vehicle and chloroquine (CQ, 100 mM for 18h) treatment. (n = 5 biological replicates, two-way ANOVA).
(I) Autophagy in Sgk1 knockout (Sgk1(−/−)) AML12 hepatocytes as indicated by LC3A/B turnover in both full medium and Hank’s balanced salt solution (HBSS) starvation conditions (n = 6 for control and n = 5 HBSS, two-way ANOVA).
(J) LC3A/B conversion in Sgk1(−/−) versus wild type (wt) AML12 cells with or without 50 μM chloroquine (CQ) for 4h (n =10 for vehicle and n = 6 for CQ, two-way ANOVA).
See also Figure S1. *p < 0.05, **p < 0.01. All bars indicate means and SEM.

