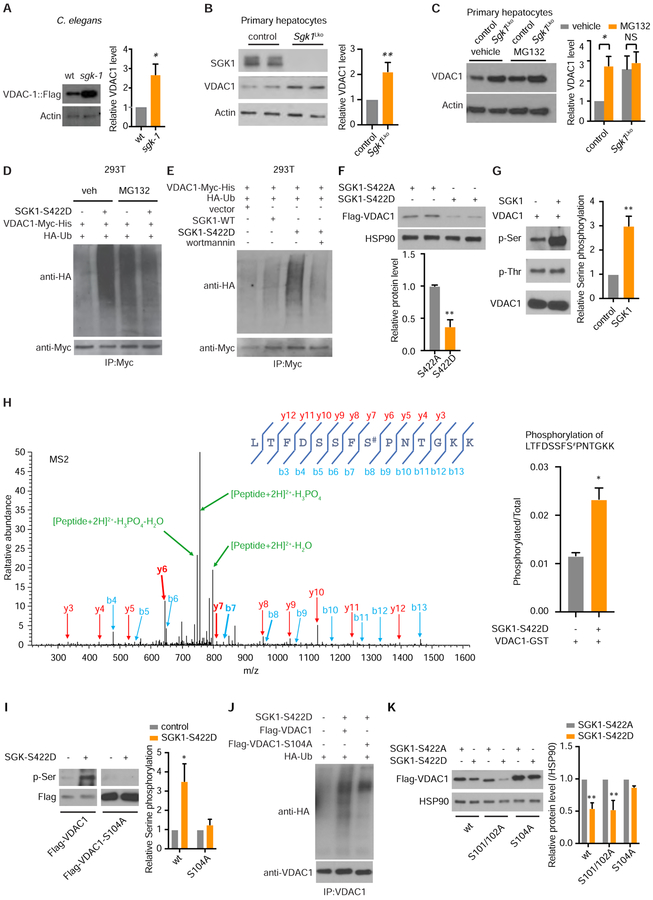
Figure 4. SGK1 Modulates VDAC1 Protein Ubiquitination and Degradation by Regulating Its Phosphorylation.
(A) Western blot for VDAC-1::Flag protein levels in sgk-1 mutant worms versus wild type (n = 3, student’s t-test).
(B) Western blotting for native VDAC1 protein in primary hepatocytes from Sgk1 liver specific knockout (Sgk1Lko) versus Sgk1flox/flox control mice (control) (n = 3 cell samples per group, each sample from 1 mouse, student’s t-test).
(C) Native VDAC1 level by western blot in control Sgk1flox/flox and Sgk1Lko primary hepatocytes with or without proteasome inhibitor MG132 (5 μM for 16h) (n = 6 cell samples per group, each sample from 1 mouse, student’s t-test).
(D-E) Overexpression of active SGK1-S422D (D) increases VDAC1 ubiquitination by western blotting for HA-Ub and (E) is unaffected by the PI3K inhibitor wortmannin. 293T cells were co-transfected with wildtype SGK1 (SGK1-WT) or active SGK1 (SGK1-S422D) with VDAC1-Myc and HA-ubiquitin for 48h. Results shown are representative of 3 biological replicates.
(F) Overexpression of active SGK1-S422D decreases co-transfected VDAC1 protein level versus overexpression of inactive SGK1-S422A (n = 4, student’s t-test).
(G) In vitro kinase assay shows increased serine phosphorylation of VDAC1 after incubation with SGK1 by western blot (n = 3, student’s t-test).
(H) MS2 spectra identifies VDAC1 Ser104 (S#) as the SGK1 phosphorylation site (n = 2, student’s t-test).
(I) SGK1 phosphorylates serine in wildtype VDAC1 but not VDAC1-S104A in vitro (n = 3, two-way ANOVA).
(J) Ubiquitination of VDAC1 and VDAC1-S104A with overexpression of active SGK1-S422D by western blot. Results shown are representative of 3 biological replicates.
(K) Overexpression of active SGK1-S422D decreases wildtype VDAC1, VDAC1-S101/102A but not VDAC1-S104A protein levels compared with inactive SGK1-S422A overexpression (n = 3, two-way ANOVA).
See also Figure S4. *p < 0.05, **p < 0.01. All bars indicate means and SEM.

