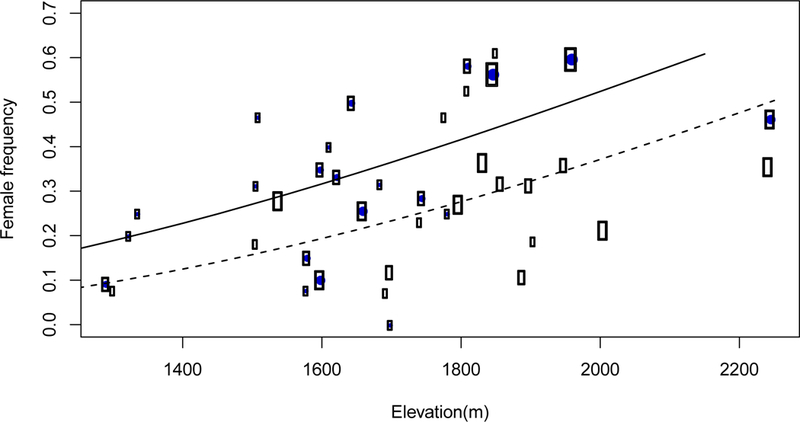
Figure 5.

Effect of elevation and disease status on female frequency. Each circle represents a single D. pavonius population, with circle size indicating the population size. Healthy populations are shown with unfilled circles and a dashed line, diseased populations are shown with filled circles and a solid line. Trend lines are from an additive model of the effect of disease status and elevation on female frequency (arcsine square-root transformed) and weighted by population size.
