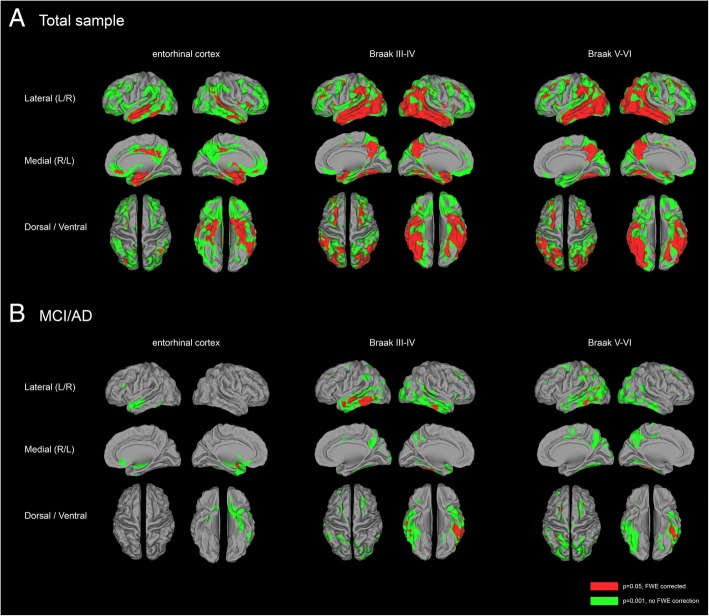
Fig. 4.
Correlations between [18F]flortaucipir BPND and voxelwise GM density. Displayed are the results of voxelwise regression analyses with [18F]flortaucipir BPND per pathology-based ROI (top) as predictor and GM density as a dependent variable for a the total sample and b MCI/AD. Analyses are adjusted for age, sex, TIV, and PET scanner type. [18F]Flortaucipir BPND images are partial volume corrected. P values are set at 0.05, family-wise error corrected (red), and with a more liberal threshold of p < 0.001 (uncorrected for multiple comparisons)

