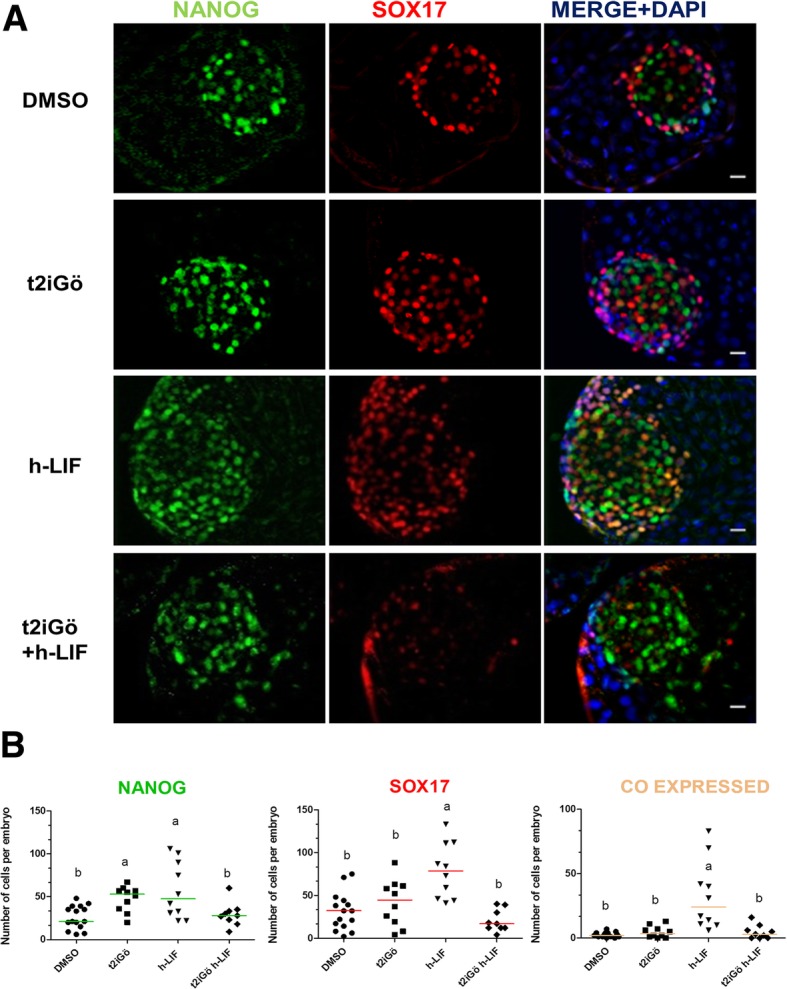
Fig. 5.

Effect of t2iGö h-LIF on NANOG and SOX17 expression on day 8 bovine embryos. a Immunostaining detection of NANOG and SOX17 in representative day 8 bovine IVF blastocysts. Each image is a single optical section. Scale bar: 10 μm. b Scatter plots showing number of cells of NANOG, SOX17 and co-expressing cells per embryo. Data were analysed by Kruskall Wallis test and are presented as Median ± IQR. Different superscripts indicate significant difference between groups (p < 0.05). N: number of embryos counted after immunofluorescence detection, N = 15; 10; 10 and 9 for DMSO, t2iGö, h-LIF, t2iGöLIF groups, respectively
