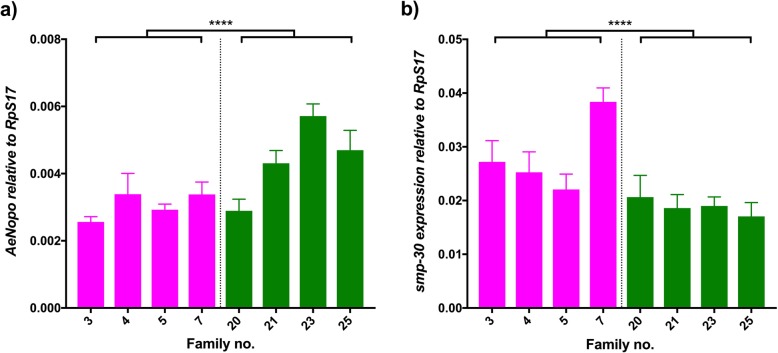
Fig. 3.
Apoptosis. Graphs show the expression of (a) AeNopo and (b) smp-30 relative to RpS17 in DENV-infected individuals. Pink bars represent refractory families; green bars represent susceptible families. Bars depict family mean and SEM (n = 5). **** p < 0.0001. The average fold change of refractory/susceptible families is 0.69 (a), 1.49 (b)

