
Fig. 3.
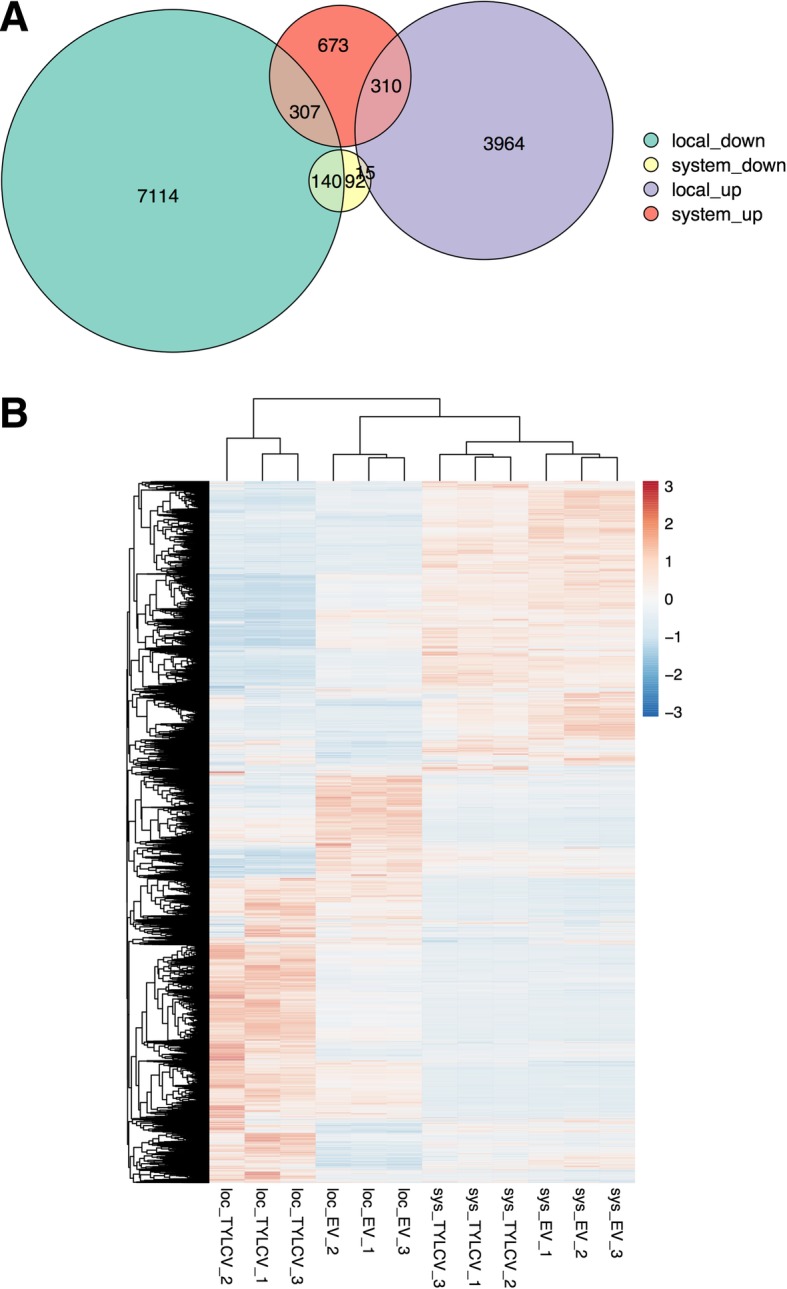
Different transcriptional changes are detected upon local and systemic infections by TYLCV in N. benthamiana. a Venn diagram of DEGs in local and systemic infections. b The differential gene expressions of local and systemic infection samples are shown in heatmap with hierarchical clustering, which is drawn by R package pheatmap. The values in the gene expression matrix are centered and scaled in the row direction. The color bar indicates the Z-score. Loc: local infections; sys: systemic infections. EV: empty vector